-
Notifications
You must be signed in to change notification settings - Fork 8
/
osm.qmd
459 lines (327 loc) · 14.9 KB
/
osm.qmd
1
2
3
4
5
6
7
8
9
10
11
12
13
14
15
16
17
18
19
20
21
22
23
24
25
26
27
28
29
30
31
32
33
34
35
36
37
38
39
40
41
42
43
44
45
46
47
48
49
50
51
52
53
54
55
56
57
58
59
60
61
62
63
64
65
66
67
68
69
70
71
72
73
74
75
76
77
78
79
80
81
82
83
84
85
86
87
88
89
90
91
92
93
94
95
96
97
98
99
100
101
102
103
104
105
106
107
108
109
110
111
112
113
114
115
116
117
118
119
120
121
122
123
124
125
126
127
128
129
130
131
132
133
134
135
136
137
138
139
140
141
142
143
144
145
146
147
148
149
150
151
152
153
154
155
156
157
158
159
160
161
162
163
164
165
166
167
168
169
170
171
172
173
174
175
176
177
178
179
180
181
182
183
184
185
186
187
188
189
190
191
192
193
194
195
196
197
198
199
200
201
202
203
204
205
206
207
208
209
210
211
212
213
214
215
216
217
218
219
220
221
222
223
224
225
226
227
228
229
230
231
232
233
234
235
236
237
238
239
240
241
242
243
244
245
246
247
248
249
250
251
252
253
254
255
256
257
258
259
260
261
262
263
264
265
266
267
268
269
270
271
272
273
274
275
276
277
278
279
280
281
282
283
284
285
286
287
288
289
290
291
292
293
294
295
296
297
298
299
300
301
302
303
304
305
306
307
308
309
310
311
312
313
314
315
316
317
318
319
320
321
322
323
324
325
326
327
328
329
330
331
332
333
334
335
336
337
338
339
340
341
342
343
344
345
346
347
348
349
350
351
352
353
354
355
356
357
358
359
360
361
362
363
364
365
366
367
368
369
370
371
372
373
374
375
376
377
378
379
380
381
382
383
384
385
386
387
388
389
390
391
392
393
394
395
396
397
398
399
400
401
402
403
404
405
406
407
408
409
410
411
412
413
414
415
416
417
418
419
420
421
422
423
424
425
426
427
428
429
430
431
432
433
434
435
436
437
438
439
440
441
442
443
444
445
446
447
448
449
450
451
452
453
454
455
456
457
458
459
---
title: "Processing large OpenStreetMap datasets for research"
# Fold code by default:
format:
html:
code-fold: false
code-summary: "Show the code"
---
# Introduction
This practical was developed for the [OpenGeoHub summer school 2023](https://pretalx.earthmonitor.org/opengeohub-summer-school-2023/schedule/).
As outlined in the session abstract, will cover
- How and where to download OSM data
- How to process small amounts of OSM data using the osmdata R package
- How to process large OSM ‘extracts’ data with the osmextract R package
- Other command line tools for working with OSM data, including the mature and widely used osmium tool, the pyrosm Python package and the osm2streets web application and Rust codebase
Finally, the session will outline ideas for using OSM data to support the fast and fair decarbonisation of the global economy.
# Prerequisites
To participate in the session, all you need is R and following packages:
```r
pkgs = c(
"tidyverse",
"osmdata",
"osmextract"
)
remotes::install_cran(pkgs)
```
Note: as of 2023-08-31 you also need to install the development version of `sf` as follows:
```r
remotes::install_github("r-spatial/sf")
```
```{r}
#| include: false
# For debugging
# remotes::install_github("r-spatial/sf")
# remotes::install_version("sf", "1.0-10")
# remotes::install_dev("osmextract")
```
You may want to install the following packages for @sec-command-line:
- [osmium](https://osmcode.org/osmium-tool/)
- [pyrosm](https://pyrosm.readthedocs.io/en/latest/)
- [osm2streets](https://a-b-street.github.io/osm2streets/#1/0/0) (although this is currently mostly a web UI and does not have a command line interface)
We will get data representing case study areas:
-
# How and where to download OSM data {#sec-download}
There are two main ways to download OSM data:
- In small amounts, which you can get from osm.org directly, and from [services]() that host the Overpass API and provide free access.
- In large amounts, which you can get from a smaller number of extract providers. Because the focus of this session is on large amounts of data, and because providers of small uncompressed datasets cannot scale to national or global datasets, we will focus on this second way of getting data, with key providers described below.
## Uncompressed OSM providers
Queries to Overpass API providers can be made directly from the [Overpass Turbo](https://overpass-turbo.eu/) web application, which has a convenient web interface that is ideal for exploring the data and writing queries iteratively.
Overpass users the [Overpass QL](https://wiki.openstreetmap.org/wiki/Overpass_API/Overpass_QL), an example of which is provided below.
You can see the results of a query at this endpoint, for example: https://overpass-turbo.eu/?Q=%28%0A+++node%2851.249%2C7.148%2C51.251%2C7.152%29%3B%0A+++%3C%3B%0A%29%3B%0Aout+meta%3B
This can be written in Overpass QL as:
```overpass
(
node(51.249,7.148,51.251,7.152);
<;
);
out meta;
```
After saving this query as a file (e.g. called `query.txt`), you can download the data using the `curl` command line tool as follows:
```bash
curl -X POST -H "Content-Type: application/x-www-form-urlencoded" -d @query.txt https://overpass-api.de/api/interpreter > data.osm
```
As outlined in the [`providers_comparison`](https://docs.ropensci.org/osmextract/articles/providers_comparisons.html) vignettte in the [`osmextract`](https://docs.ropensci.org/osmextract/) package, there are several providers of OSM data. The main ones that provide regular extracts without need for logins are:
- [geofabrik](https://download.geofabrik.de/)
- [openstreetmap_fr](http://download.openstreetmap.fr/)
- [bbbike](https://download.bbbike.org/osm/bbbike/)
```{r}
library(osmextract)
library(sf)
```
Extracts from each provider are shown in the figures below, generated by code that can be 'unfolded' by clicking on the arrows:
## Geofabrik
`geofabrik` is a company that provides map-based services and free downloads of OSM extracts that are updated daily.
These extracts are based on a division of the world into different regions, at 4 different levels.
Zones in level 1 cover a whole continent (plus Russian Federation):
```{r}
#| code-fold: true
par(mar = rep(0, 4))
plot(geofabrik_zones[geofabrik_zones$level == 1, "name"], key.pos = NULL, main = NULL)
```
Level 2 contains polygons representing several countries all around the world:
```{r}
#| code-fold: true
plot(geofabrik_zones[geofabrik_zones$level == 2, "name"], key.pos = NULL, main = NULL)
```
Geofabrik also defines several special zones, such as Alps, Britain and Ireland, Germany, Austria and Switzerland, US Midwest, US Northeast, US Pacific, US South and US West (level 3).
Moreover, it contains extracts relative to some administrative subregions, mainly in Europe, Russia, Canada and South America:
```{r}
#| code-fold: true
plot(geofabrik_zones[geofabrik_zones$level == 3, "name"], key.pos = NULL, main = NULL)
```
Check `?geofabrik_zones` and the [provider's webpage](http://download.geofabrik.de/) for more details.
## Openstreetmap.fr
`openstreetmap_fr` extracts are taken from http://download.openstreetmap.fr/, a web-service that provides OSM data updated every few minutes.
The extracts are based on several regions, such as the continents (level 1):
```{r}
#| code-fold: true
# Russian federation is considered as a level 1 zone
plot(openstreetmap_fr_zones[openstreetmap_fr_zones$level == 1, "name"], key.pos = NULL, main = NULL)
```
or some countries around the world (less than `geofabrik`'s level 2 zones):
```{r}
#| code-fold: true
plot(openstreetmap_fr_zones[openstreetmap_fr_zones$level == 2, "name"], key.pos = NULL, main = NULL)
```
It can be noticed that there are several holes (such as Peru, which is the reason why, in the first example, Lima was matched with South America data), implying that `openstreetmap_fr` cannot always be used for geographical matching of a `place`.
Nevertheless, it provides extremely detailed extracts for some regions of the world, like China,
```{r}
#| code-fold: true
plot(openstreetmap_fr_zones[openstreetmap_fr_zones$parent == "china", "name"], key.pos = NULL, main = NULL)
```
India,
```{r}
#| code-fold: true
plot(openstreetmap_fr_zones[openstreetmap_fr_zones$parent == "india", "name"], key.pos = NULL, main = NULL)
```
France,
```{r}
#| code-fold: true
ids_2 = openstreetmap_fr_zones$parent %in% "france"
ids_3 = openstreetmap_fr_zones$parent %in% openstreetmap_fr_zones$id[ids_2]
plot(openstreetmap_fr_zones[ids_2 | ids_3, "name"], key.pos = NULL, main = NULL)
```
and Brazil
```{r}
#| code-fold: true
ids_2 = openstreetmap_fr_zones$parent %in% "brazil"
ids_3 = openstreetmap_fr_zones$parent %in% openstreetmap_fr_zones$id[ids_2]
plot(openstreetmap_fr_zones[ids_2 | ids_3, "name"], key.pos = NULL, main = NULL)
```
## BBBike
`bbbike` provider is based on https://download.bbbike.org/osm/bbbike/.
It is quite different from any other provider supported in `osmextract` since it contains OSM data for more than 200 cities worldwide.
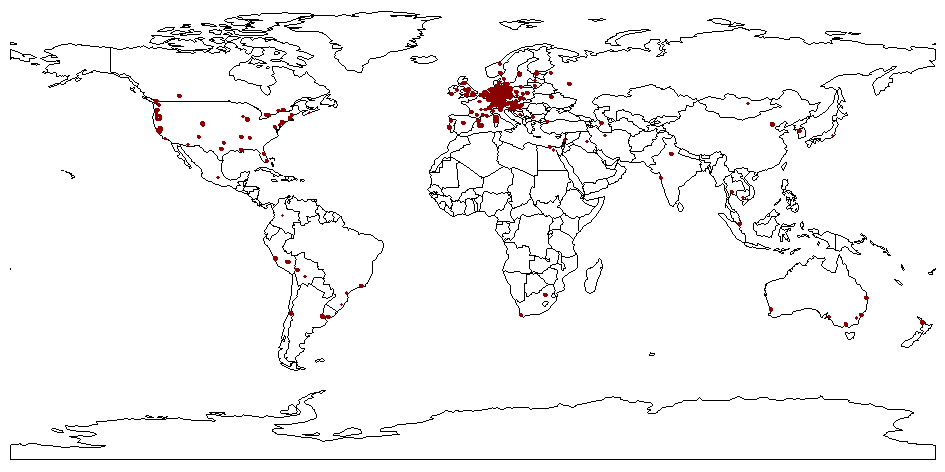
`bbbike` provider is the safest choice if you are looking for OSM data relative to a particular city in the world.
# How to process small amounts of OSM data using the osmdata R package {#sec-osmdata}
The [osmdata](https://cran.r-project.org/package=osmdata) package is a mature and widely used tool for working with OSM data in R. It is designed to work with small amounts of data, such as the area around a city or a country. It is not designed to work with large amounts of data, such as the whole of Europe or the world. For that, we need a different approach, which is covered in the next section.
# How to process large OSM ‘extracts’ data with the osmextract R package {#sec-osmextract}
The quickest way to get large OSM datasets in R (and possibly in any data analysis framework) is to use the [`osmextract`](https://docs.ropensci.org/osmextract/) package.
The package makes your life easy by automating many parts of the OSM extract identification, download, and processing pipeline, so you can focus on the analysis and high-impact reasearch!
## Finding an extract to download
Let's see how it works for the city of Poznan:
We geocode the coordinates of Poznan, Poland
```{r, eval = FALSE}
poznan = tmaptools::geocode_OSM("Poznan, Poland")$coords
# poznan = c(x = 16.933, y = 52.408)
```
```{r}
#| echo: false
#| eval: false
dput(poznan)
c(x = 16.9335199, y = 52.4082663)
```
```{r, echo = FALSE}
poznan = c(x = 16.933, y = 52.408)
```
and look for a match in the OSM extracts using `oe_match()`:
```{r, warning = FALSE, message = FALSE}
oe_match(poznan, provider = "geofabrik")
oe_match(poznan, provider = "bbbike")
oe_match(poznan, provider = "openstreetmap_fr")
```
As shown above, `bbbike` is the only provide that provides a match for Poznan (the others match with all of Poland).
## Downloading the extract
We can download the extract using `oe_get()`, noting the user of `layer = "points"` to get the points layer of the OSM data:
```{r, warning = FALSE, message = FALSE}
#| eval: false
#| echo: false
poznan = oe_get("Poznan", provider = "bbbike", layer = "points", force_vectortranslate = TRUE)
# fails with
# The input place was matched with: Poznan
# The chosen file was already detected in the download directory. Skip downloading.
# Starting with the vectortranslate operations on the input file!
# 0...10...20...30...40...50...60...70...80...90...100 - done.
# Finished the vectortranslate operations on the input file!
```
```{r}
#| eval: false
poznan = oe_get("Poznan", provider = "bbbike", force_vectortranslate = TRUE)
```
Find where the file is as follows:
```{r}
#| eval: false
poznan_file = oe_find("Poznan", provider = "bbbike", return_gpkg = FALSE)
# [1] "/home/robin/data/osm/bbbike_Poznan.osm.pbf"
```
Note: you can check the location where datasets will be downloaded and translated using the [`oe_set_download_directory()`](https://docs.ropensci.org/osmextract/reference/oe_download_directory.html) function (see `?oe_set_download_directory` for details).
We uploaded data for Poznan to [github.com/Robinlovelace/opengeohub2023/releases](https://github.com/Robinlovelace/opengeohub2023/releases/tag/v2).
For future reference, you can access the 25 MB PBF file from https://github.com/Robinlovelace/opengeohub2023/releases/download/v2/bbbike_Poznan.osm.pbf
```{r}
#| eval: false
file.copy(poznan_file, ".")
msg_upload_github = glue::glue("gh release create v2 {poznan_file}")
system(msg_upload_github)
```
Note: that takes quite a while download, so we will use a smaller extract for the rest of the session:
```{r}
monaco_osm_points = oe_get("monaco", provider = "bbbike", layer = "points")
```
```{r}
#| message: false
#| results: "hide"
# ?oe_get
monaco_osm_lines = oe_get("monaco", provider = "bbbike", layer = "lines")
monaco_osm_mlines = oe_get("monaco", provider = "bbbike", layer = "multilinestrings")
monaco_osm_polygons = oe_get("monaco", provider = "bbbike", layer = "multipolygons")
monaco_osm_other = oe_get("monaco", provider = "bbbike", layer = "other_relations")
```
You can look at the files downloaded as follows:
```{r}
f = list.files(oe_download_directory(), pattern = "monaco", full.names = TRUE)
f
monaco = sf::read_sf(f[1])
monaco = sf::read_sf(f[2], layer = "lines")
```
Let's take a look at the size of each layer, in units of MB:
```{r}
#| code-fold: true
sizes_mb = sapply(list(monaco_osm_points, monaco_osm_lines, monaco_osm_mlines, monaco_osm_polygons, monaco_osm_other), function(x) {
round(object.size(x) / 1e6, 1)
})
layer_names = c("points", "lines", "multilinestrings", "multipolygons", "other_relations")
n_features = sapply(list(monaco_osm_points, monaco_osm_lines, monaco_osm_mlines, monaco_osm_polygons, monaco_osm_other), nrow)
size_df = data.frame(
layer = layer_names,
size_mb = sizes_mb,
n_features = n_features,
kb_per_feature = sizes_mb / n_features * 1e3
)
knitr::kable(size_df)
```
## Exercises
- Create maps of the different layers using `{tmap}`, `{ggplot2}` or a mapping package of your choice.
- Which layer is most interesting for your research?
- Are there any phenomena that are represented in more than one layer and, if so, thoughts on how to combine them?
## More on osmextract
TODO: complete this section : )
## Clipping an area of interest
Rather than read-in the entire extract, you can read-in a subset...
```{r}
pois_buffer_simple = sf::st_read("https://github.com/Robinlovelace/opengeohub2023/raw/main/pois_buffer_simple.geojson")
```
# Other command line tools for working with OSM data {#sec-command-line}
## pyrosm
Install the Python package `pyrosm` as follows:
```bash
pip install pyrosm
```
```{r}
#| include: false
# Install pyrosm if not already installed:
# Installed Python packages:
py_pkgs = reticulate::py_list_packages()
py_pkg_names = py_pkgs$package
if (!"pyrosm" %in% py_pkg_names) {
reticulate::py_install("pyrosm")
}
```
<!---
See issue here https://github.com/HTenkanen/pyrosm/issues/217
--->
Search for Poznan in extracts available from `pyrosm` as follows (note: this fails for me currently as documented in [github.com/HTenkanen/pyrosm/issues/217](https://github.com/HTenkanen/pyrosm/issues/217)):
```{python}
#| eval: false
import pyrosm
from pyrosm import OSM
import geopandas as gpd
poznan_file = pyrosm.get_data("Poznan")
osm = OSM(poznan_file)
poznan_cycling = osm.get_network(network_type="cycling")
poznan_cycling.plot()
```
## osmnx
Install the Python package `osmnx` as follows:
```bash
pip install osmnx
```
```{r}
#| include: false
# Install osmnx if not already installed:
# Installed Python packages:
if (!"osmnx" %in% py_pkg_names) {
reticulate::py_install("osmnx")
reticulate::py_install("geopandas")
reticulate::py_install("matplotlib")
}
```
```{python}
import osmnx as ox
import pandas as pd
import geopandas as gpd
# Get cycle netework for Poznan
poznan_polygon = ox.geocode_to_gdf("Poznan, Poland")
poznan_polygon.plot();
```
That is quite a big network, so let's get the area of the polygon and use that to get a smaller network from [GitHub](https://github.com/Robinlovelace/opengeohub2023/raw/main/pois_buffer_simple.geojson):
```{python}
# Get data from https://github.com/Robinlovelace/opengeohub2023/raw/main/pois_buffer_simple.geojson:
poznan_small = gpd.read_file("https://github.com/Robinlovelace/opengeohub2023/raw/main/pois_buffer_simple.geojson")
poznan_small.plot();
```
Download the cycling network as follows:
```{python}
G_cycle = ox.graph_from_polygon(poznan_small.geometry[0], network_type="bike")
```
Plot the results:
```{python}
ox.plot_graph(G_cycle)
```
Get basic stats as follows:
```{python}
area = ox.project_gdf(poznan_small).unary_union.area
stats = ox.basic_stats(G_cycle, area=area)
pd.Series(stats)
```
Calculate the centrality across the network as follows:
```{python}
```
We can convert the object into a 'GeoDataFrame' as follows:
```{python}
cycle_gdf = ox.graph_to_gdfs(G_cycle, edges=True)
```
```{python}
```
# Ideas for using OSM data {#sec-ideas}
# References