Metrics of last restarted instance looks a bit overloaded #22254
Comments
|
Thanks for reporting Anton. I have this on the 'performance Issues' list |
|
We restart instances every night to mitigate RC memory leak and other performance issue and I found that these much more loaded instance is that actual instance that was rebooted last. We change order of reboot and now you can see another instance with much more metric size and other metrics So I will change topic a bit. |


|
still see it in 3.18.1 |
|
Still on 4.2.2 |


Sign up for free
to join this conversation on GitHub.
Already have an account?
Sign in to comment
Description:
We have docker deployment with 25 instances for users connections and 2 instances for present monitor without users (actually one with presence monitor enabled).
But we have couple instances with strange load according to Rocket chat Metrics.
That instances have completely similar configurations in docker-compose.yml file and normal users amount (not more then other instances)
Steps to reproduce:
Expected behavior:
All instances should have similar load and metrics.
Actual behavior:
Here is a metric size graph


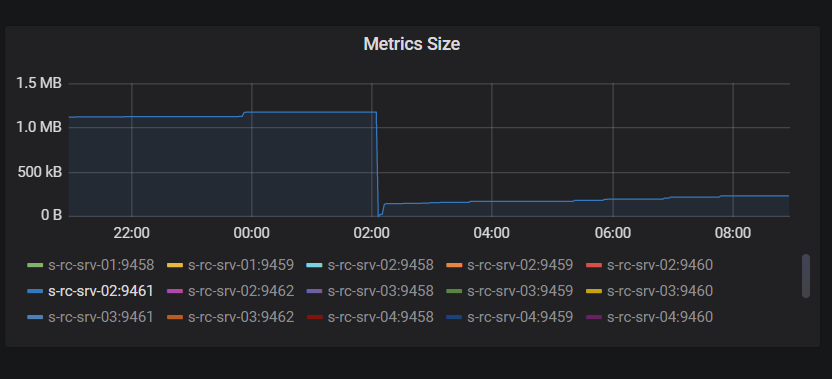


As you can see 5 instance on 2 server have much more metrics size
And another screen right now
And 4 instance on that same 2 server too
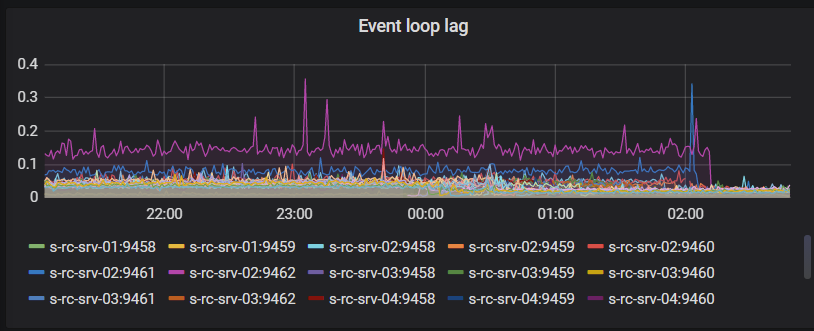
Event loop lag is bigger then other instances
Pod heap same as others
But amount of WS sessions is even less then other instances
Server Setup Information:
Client Setup Information
Additional context
That graphs collected at weekend with really low load, but metrics for that few instances behave same all times.
In general all 5 (last) instances have more metrics size and event loop lag.
We restart every instances one-by-one and in each server I restart from 5 to 1 instances (5-4-3-2-1)
So 5 instance of 5 server restarted first and 1 instance of 2 server restarted last (actually 1 instance of 1 server restarted last, but 1 server holds 2 instances without user sessions)
Relevant logs:
No
The text was updated successfully, but these errors were encountered: