Skip to content
New issue

Have a question about this project? Sign up for a free GitHub account to open an issue and contact its maintainers and the community.

By clicking “Sign up for GitHub”, you agree to our terms of service and privacy statement. We’ll occasionally send you account related emails.

Already on GitHub? Sign in to your account

Blend two image into 1 image #260

Closed
minhdl93 opened this issue Aug 31, 2021 · 4 comments
Closed

Blend two image into 1 image #260

minhdl93 opened this issue Aug 31, 2021 · 4 comments

Comments

@minhdl93
Copy link

Hi,

I want to blend two images into one image like in matplotlib. Is it possible? Because when I tried this code, it plotted two images

`isns.set_image(cmap="magma", origin="upper",despine=True)

    isns.imgplot(im.resize((w, h), Image.ANTIALIAS),alpha=0.5)

    isns.imgplot(dec_attn_weights[0, idx].view(h, w))

    plt.show()`

Capture

@SarthakJariwala
Copy link
Owner

Hi @DangLienMinh - Yes, that is possible with the ax parameter.

You can do the following -

ax1 = isns.imgplot(IMG_1)  # Generates first image
ax = isns.imgplot(IMG_2, ax=ax1)  # Adds second image to the axes of the first image

Note the ax=ax1 in the second function.

@minhdl93
Copy link
Author

minhdl93 commented Aug 31, 2021

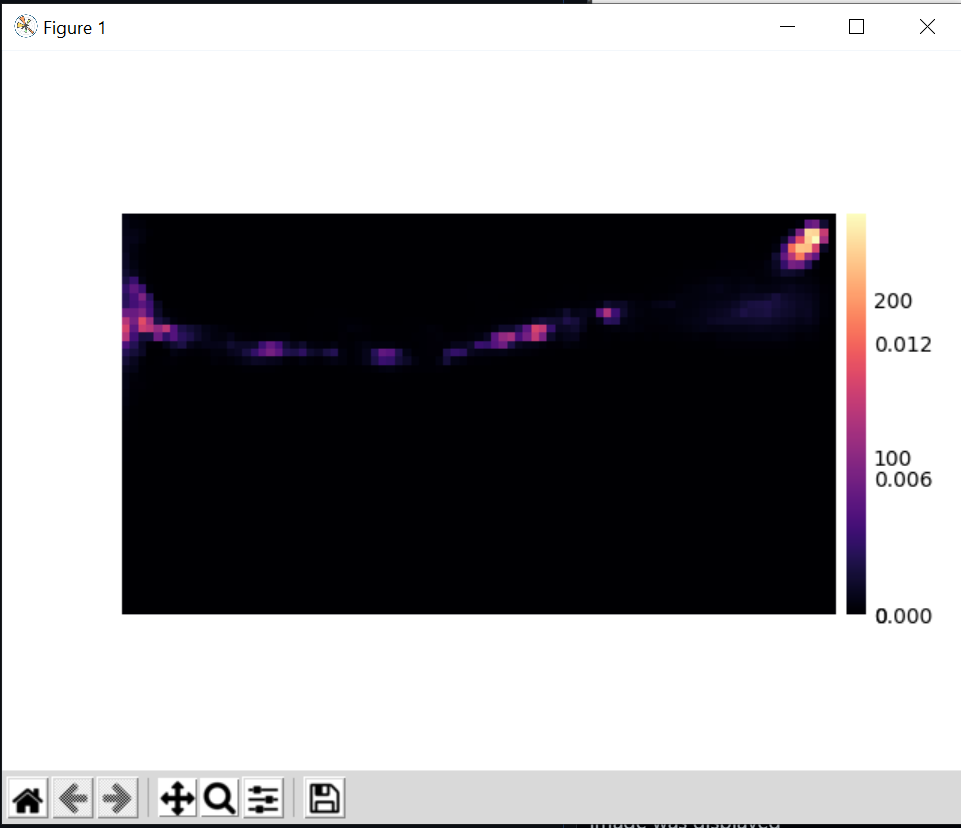
Hi @SarthakJariwala, Thank you very much for your help. I tried the mentioned method. However, the result was like this. Only one image was displayed

` isns.set_image(cmap="magma", origin="upper",despine=True)

    ax1 = isns.imgplot(im.resize((w, h), Image.ANTIALIAS),alpha=0.3)

    ax = isns.imgplot(dec_attn_weights[0, idx].view(h, w),ax= ax1)

    plt.show()`

image

I want something similar to this where image 1 overlay image 2

image

@minhdl93 minhdl93 reopened this Aug 31, 2021
@SarthakJariwala
Copy link
Owner

You would want to have the alpha parameter for the second image (the image that you are plotting as the overlay). Otherwise, if the second image is opaque, it will completely block the first image (basically the result that you got).

So, you can try -

ax = isns.imgplot(dec_attn_weights[0, idx].view(h, w))
ax = isns.imgplot(im.resize((w, h), Image.ANTIALIAS), alpha=0.3, ax=ax)

@minhdl93
Copy link
Author

minhdl93 commented Sep 1, 2021

Thank you very much. It worked perfectly

@minhdl93 minhdl93 closed this as completed Sep 1, 2021
Sign up for free to join this conversation on GitHub. Already have an account? Sign in to comment
Labels
None yet
Projects
None yet
Development

No branches or pull requests

2 participants