Create histogram plot of a volume and show it embedded in the view layout. More information: https://www.slicer.org/wiki/Documentation/Nightly/Developers/Plots
# Get a volume from SampleData and compute its histogram
import SampleData
import numpy as np
volumeNode = SampleData.SampleDataLogic().downloadMRHead()
histogram = np.histogram(arrayFromVolume(volumeNode), bins=50)

chartNode = slicer.util.plot(histogram, xColumnIndex = 1)
chartNode.SetYAxisRangeAuto(False)
chartNode.SetYAxisRange(0, 4e5)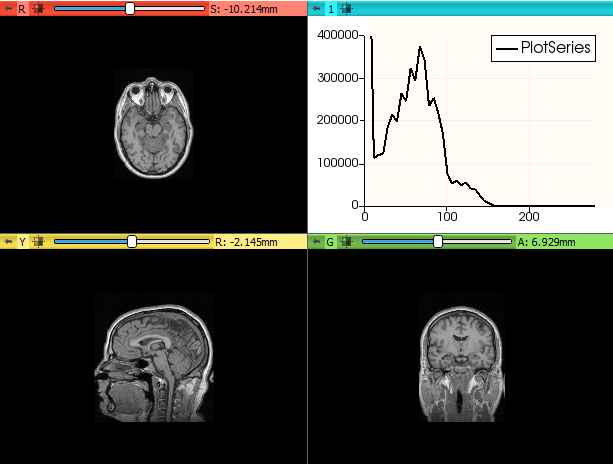
# Get a volume from SampleData
import SampleData
volumeNode = SampleData.SampleDataLogic().downloadMRHead()

# Compute histogram values
import numpy as np
histogram = np.histogram(arrayFromVolume(volumeNode), bins=50)

# Save results to a new table node
tableNode=slicer.mrmlScene.AddNewNodeByClass("vtkMRMLTableNode")
updateTableFromArray(tableNode, histogram)
tableNode.GetTable().GetColumn(0).SetName("Count")
tableNode.GetTable().GetColumn(1).SetName("Intensity")

# Create plot
plotSeriesNode = slicer.mrmlScene.AddNewNodeByClass("vtkMRMLPlotSeriesNode", volumeNode.GetName() + " histogram")
plotSeriesNode.SetAndObserveTableNodeID(tableNode.GetID())
plotSeriesNode.SetXColumnName("Intensity")
plotSeriesNode.SetYColumnName("Count")
plotSeriesNode.SetPlotType(plotSeriesNode.PlotTypeScatterBar)
plotSeriesNode.SetColor(0, 0.6, 1.0)

# Create chart and add plot
plotChartNode = slicer.mrmlScene.AddNewNodeByClass("vtkMRMLPlotChartNode")
plotChartNode.AddAndObservePlotSeriesNodeID(plotSeriesNode.GetID())
plotChartNode.YAxisRangeAutoOff()
plotChartNode.SetYAxisRange(0, 500000)

# Show plot in layout
slicer.modules.plots.logic().ShowChartInLayout(plotChartNode)plotView = slicer.app.layoutManager().plotWidget(0).plotView()
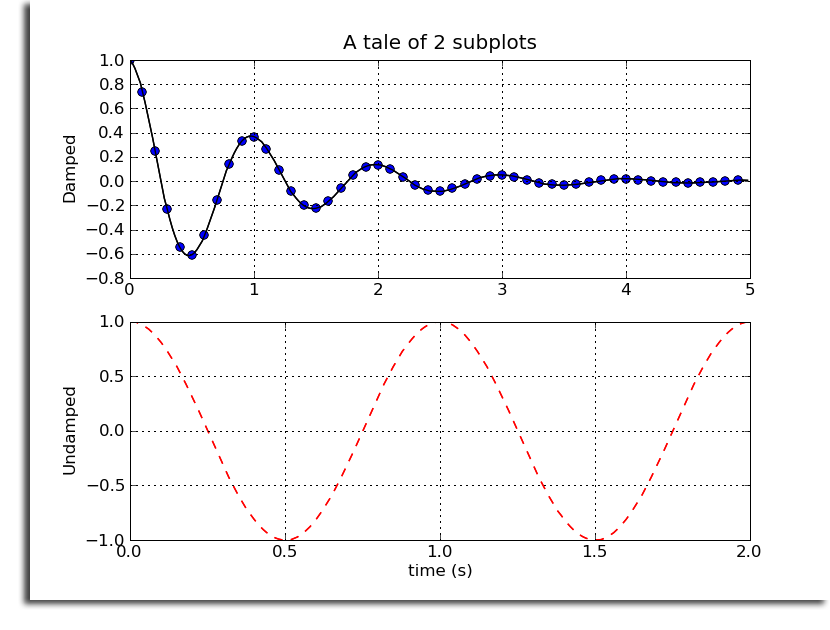
plotView.saveAsSVG("c:/tmp/test.svg")Matplotlib may be used from within Slicer, but the default Tk backend locks up and crashes Slicer. However, Matplotlib may still be used through other backends. More details can be found on the MatPlotLib pages.
try:
  import matplotlib
except ModuleNotFoundError:
  slicer.util.pip_install("matplotlib")
  import matplotlib

matplotlib.use("Agg")
from pylab import *

t1 = arange(0.0, 5.0, 0.1)
t2 = arange(0.0, 5.0, 0.02)
t3 = arange(0.0, 2.0, 0.01)

subplot(211)
plot(t1, cos(2*pi*t1)*exp(-t1), "bo", t2, cos(2*pi*t2)*exp(-t2), "k")
grid(True)
title("A tale of 2 subplots")
ylabel("Damped")

subplot(212)
plot(t3, cos(2*pi*t3), "r--")
grid(True)
xlabel("time (s)")
ylabel("Undamped")
savefig("MatplotlibExample.png")

# Static image view
pm = qt.QPixmap("MatplotlibExample.png")
imageWidget = qt.QLabel()
imageWidget.setPixmap(pm)
imageWidget.setScaledContents(True)
imageWidget.show()
:::{tip}
To learn how to use {func}slicer.util.pip_install within a Slicer module, refer to the example in the Script Repository.
:::
import JupyterNotebooksLib as slicernb
try:
  import matplotlib
except ModuleNotFoundError:
  pip_install("matplotlib")
  import matplotlib

matplotlib.use("Agg")

import matplotlib.pyplot as plt
import numpy as np

def f(t):
  s1 = np.cos(2*np.pi*t)
  e1 = np.exp(-t)
  return s1 * e1

t1 = np.arange(0.0, 5.0, 0.1)
t2 = np.arange(0.0, 5.0, 0.02)
t3 = np.arange(0.0, 2.0, 0.01)


fig, axs = plt.subplots(2, 1, constrained_layout=True)
axs[0].plot(t1, f(t1), "o", t2, f(t2), "-")
axs[0].set_title("subplot 1")
axs[0].set_xlabel("distance (m)")
axs[0].set_ylabel("Damped oscillation")
fig.suptitle("This is a somewhat long figure title", fontsize=16)

axs[1].plot(t3, np.cos(2*np.pi*t3), "--")
axs[1].set_xlabel("time (s)")
axs[1].set_title("subplot 2")
axs[1].set_ylabel("Undamped")

slicernb.MatplotlibDisplay(matplotlib.pyplot)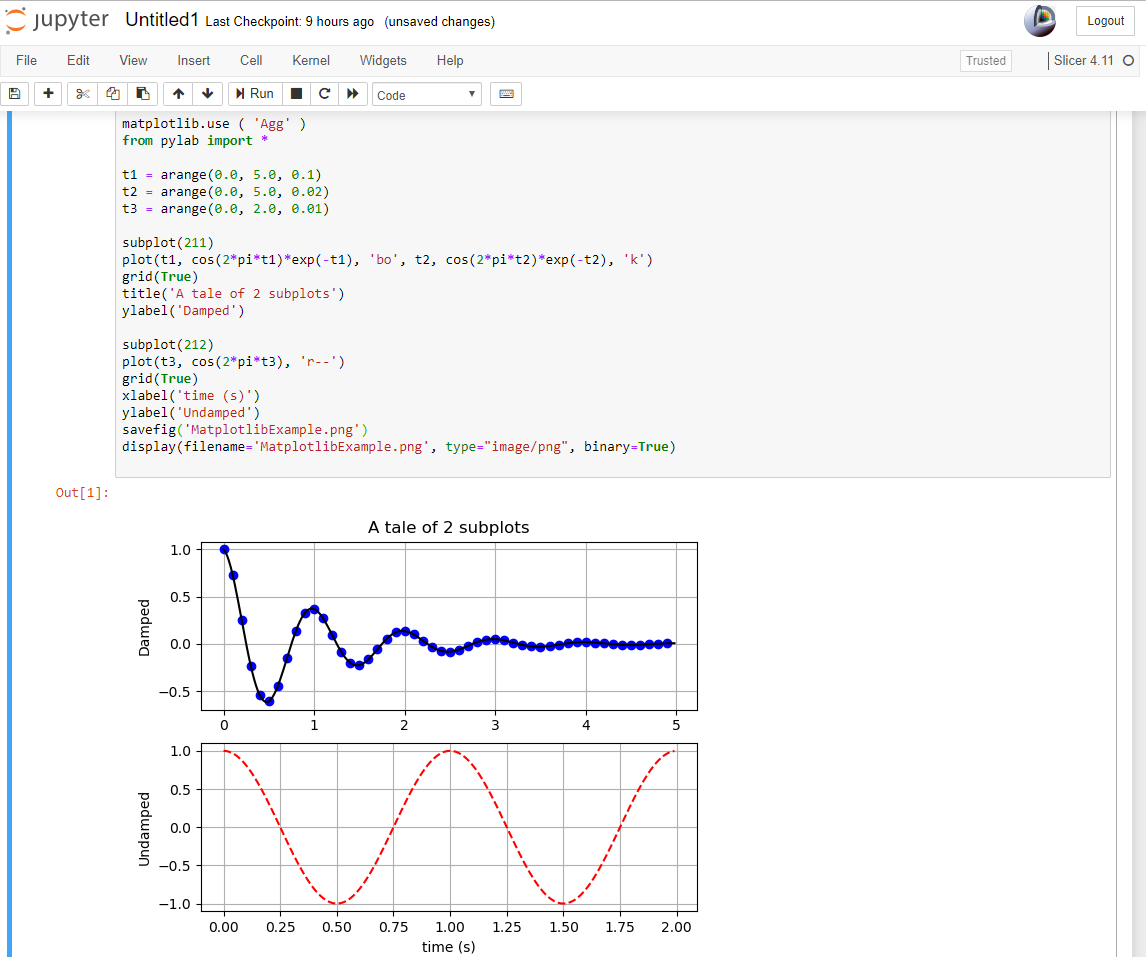
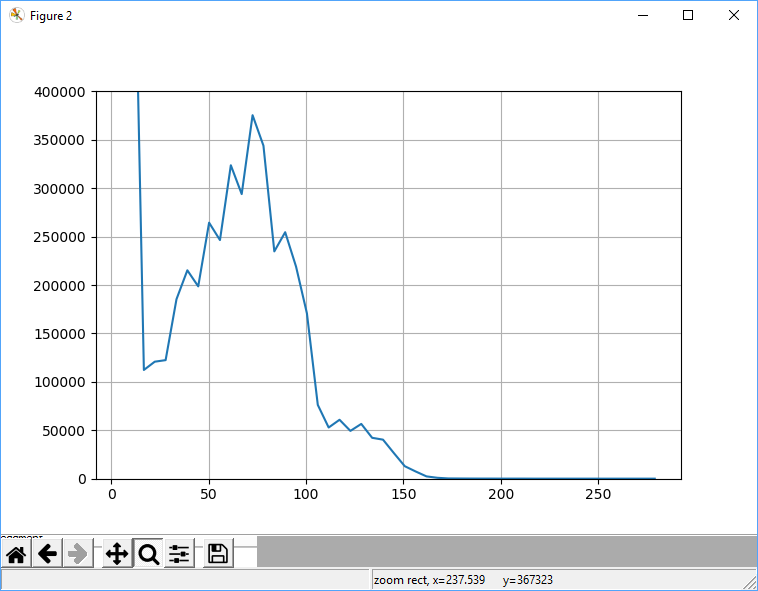
try:
  import matplotlib
  import wx
except ModuleNotFoundError:
  pip_install("matplotlib wxPython")
  import matplotlib

# Get a volume from SampleData and compute its histogram
import SampleData
import numpy as np
volumeNode = SampleData.SampleDataLogic().downloadMRHead()
histogram = np.histogram(arrayFromVolume(volumeNode), bins=50)

# Set matplotlib to use WXAgg backend
import matplotlib
matplotlib.use("WXAgg")

# Show an interactive plot
import matplotlib.pyplot as plt
fig, ax = plt.subplots()
ax.plot(histogram[1][1:], histogram[0].astype(float))
ax.grid(True)
ax.set_ylim((0, 4e5))
plt.show(block=False)
:::{tip}
To learn how to use {func}slicer.util.pip_install within a Slicer module, refer to the example in the Script Repository.
:::