/
index.Rmd
64 lines (37 loc) · 3.4 KB
/
index.Rmd
1
2
3
4
5
6
7
8
9
10
11
12
13
14
15
16
17
18
19
20
21
22
23
24
25
26
27
28
29
30
31
32
33
34
35
36
37
38
39
40
41
42
43
44
45
46
47
48
49
50
51
52
53
54
55
56
57
58
59
60
61
62
63
64
---
title: "Enter the Tidyverse"
author: "Kevin Wang and Garth Tarr"
date: "2-3 December 2019"
---
# Aim of this workshop
In this workshop, we will teach you some necessary data wrangling skills to turn a piece of real clinical data into a nicely written report. We will be operating under the `tidyverse` framework in `R`, which is very powerful for data manipulations, visualisation and modelling.
# What is the `tidyverse`?
The `tidyverse` is a collection of `R` packages that aims to streamline the following workflow.
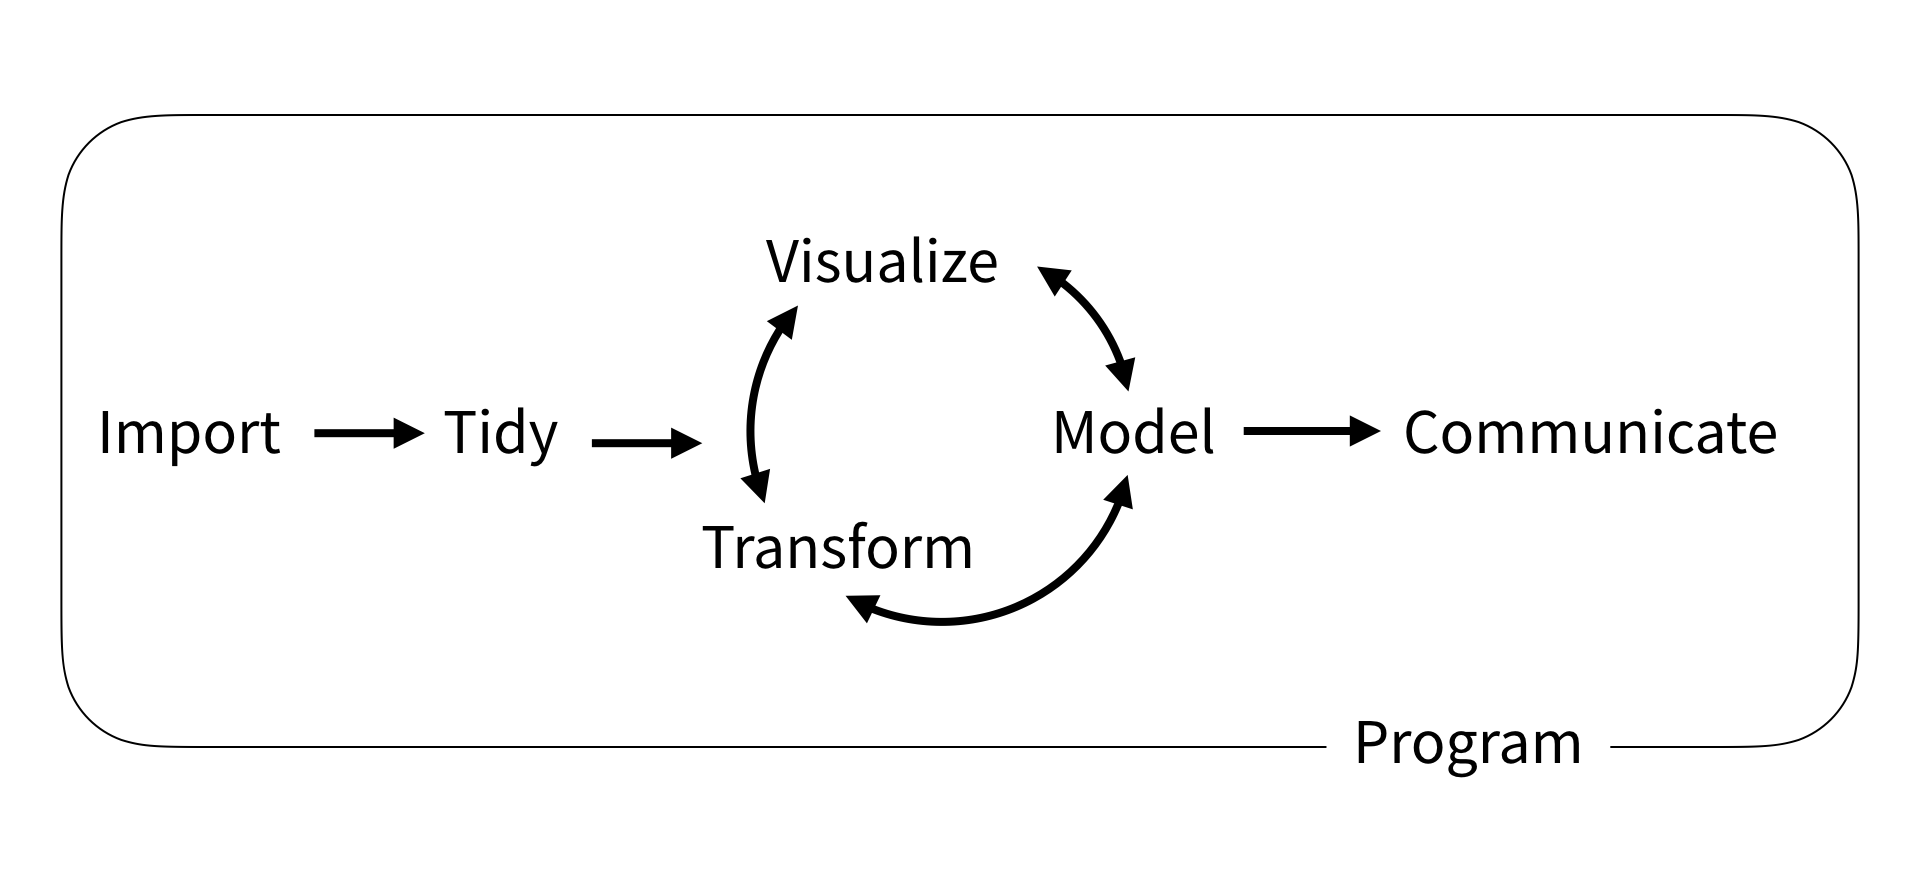
While we will not cover every package in the `tidyverse`, we will cover the most important packages across three sessions.
# Slides
+ [Slides](slides/slides.html)
# Plan of the workshop {.tabset}
## 1. Monday (15:20-16:30)
In this session, we will first familiarise ourselves of the basics of `R`, e.g. loading in an Excel dataset, recognising variable types. We will be using the `R Markdown` documentation system, which allows us to execute codes, visualise output and writing a report. We will also start to learn the basics of data manipulations such as filtering of observations and selection of columns.
Some of the packages to be covered: `rmarkdown`, `readr`, `readxl`, `voom`, `janitor` and `dplyr`.
## 2. Tuesday (13:30-15:00)
In this session, we will focus on the basics of data cleaning and data visualisation. This type of tasks is where the `tidyverse` framework becomes one of the most powerful tools in data science. We will learn how to summarise data, converting between "wide" and "tall" data frames for the purpose of visualisation and also how to integrate different datasets. At the end of this session, we will massage the data into a suitable format that we can start to think about modelling in the next session.
Some of the packages to be covered: `dplyr`, `tidyr` and `ggplot2`.
## 3. Tuesday (15:30-17:00)
In this session, we will focus on the modelling of our cleaned data from the previous session. We will first introduce lists and use `for` loops to perform some basic modelling tasks to understand the basics of `R` programming. Then, we will introduce some powerful wrapper functions that can help us to write better and cleaner codes.
Some of the packages to be covered: `tibble`, `broom` and `purrr`.
# Prerequisites
Ideally, you should at least know what `R` is, since this is not a programming workshop, you can still pick up important practical skills by running the codes we provided.
## Running workshop on the cloud
We will use RStudio Cloud to run this workshop.
1. Go to https://rstudio.cloud/, create an account and log in.
2. Click the little arrow next to the "New Project" and select "New Project from Git Repo".
3. Enter "https://github.com/SydneyBioX/tidy2019" (it will download some things)
4. Run this line of code `source("install.R")` (this may take a few minutes to run, set it running then get involved in the icebreaker activity!)
## Running workshop locally {#local}
1. Download https://github.com/SydneyBioX/tidy2019/archive/master.zip
2. Unzip the file and open up `tidy2019.RProj`.
2. Run this line of code `source("install.R")`
# Clipboard
In some circumstances, we might need to share codes beyond the existing materials. Please click [here](https://docs.google.com/document/d/136YffzxjkUM8RIGsnjD_yOkCTWw4Ijdwjy4_58nC-zc/edit?usp=sharing) to access these codes.