-
Notifications
You must be signed in to change notification settings - Fork 14
/
grafanaDocker.md
20 lines (14 loc) · 954 Bytes
/
grafanaDocker.md
1
2
3
4
5
6
7
8
9
10
11
12
13
14
15
16
17
18
19
20
# Grafana Docker
Grafana is a complete observability stack that allows you to monitor and analyze metrics, logs and traces. It allows you to query, visualize, alert on and understand your data no matter where it is stored. Create, explore, and share beautiful dashboards with your team and foster a data driven culture. For more information, refer to [Grafana overview](https://grafana.com/grafana/).
## Docker Compose
`grafana.yml`
- `sudo chown -R 472:472 ./data/grafana`
- [http://grafana:3000/](http://grafana:3000/)
- Grafana User: admin / admin
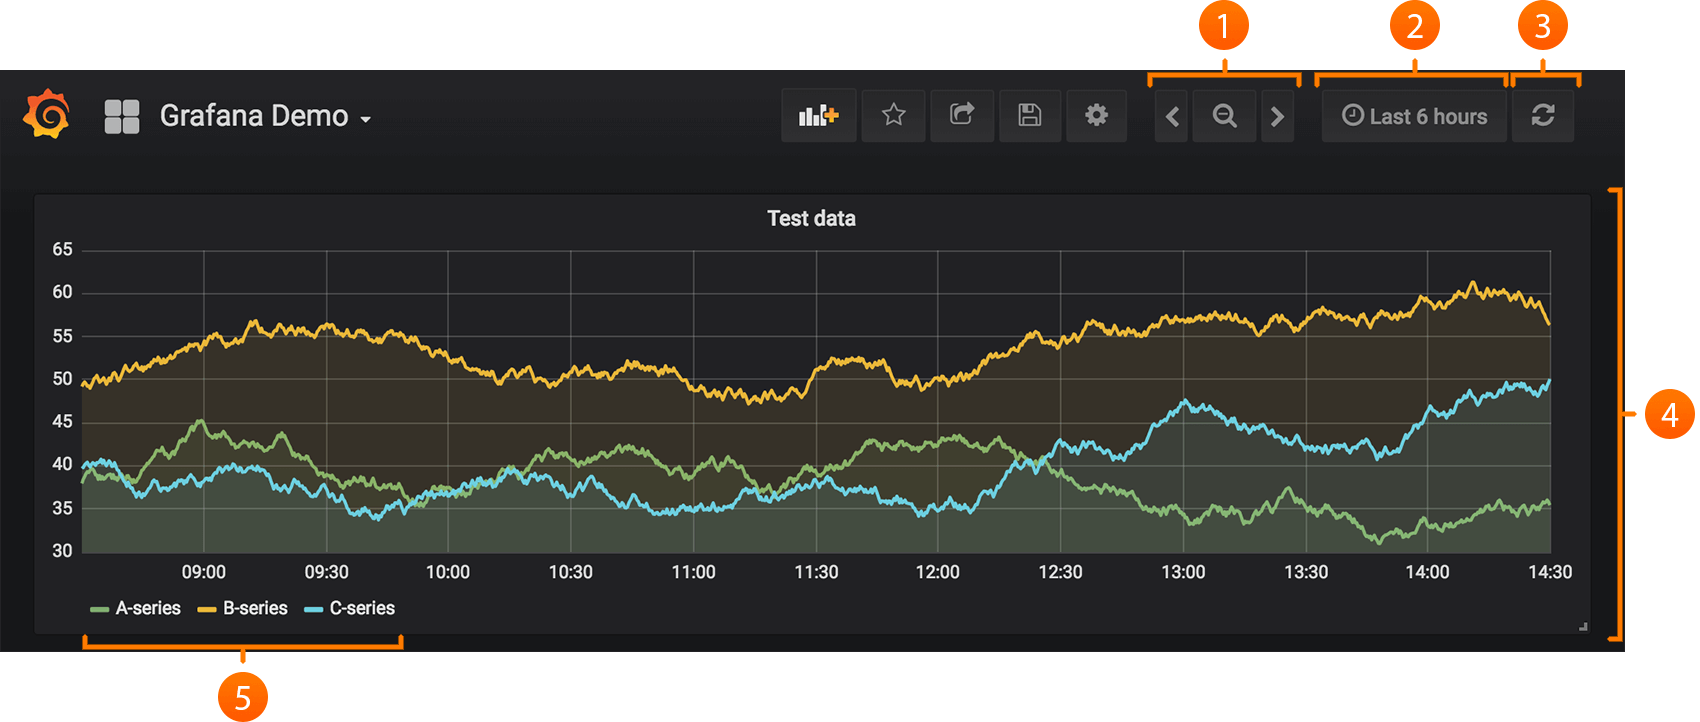
## Screenshots

## References
- [Run Grafana Docker image](https://grafana.com/docs/grafana/latest/installation/docker/)
- [Grafana Dashboards](https://grafana.com/grafana/dashboards)
- [2MySQL Simple Dashboard](https://grafana.com/grafana/dashboards/7991)