Civisualize is a civiCRM extension which let you visualize your civiCRM data with the power of dc.js and d3.js. dc.js let users create graphs which enable filtering through the data with just a click on the graphs giving you a lot of powers. It's in beta, not going to hurt to hurt your data, do let us know if something works or doesn't.
Civisualize will help you out with ready to use visualizations that we have created and will provide you the right resources if you plan to create your own custom visualization.
You can directly clone to your civiCRM extension directory using
git clone https://github.com/TechToThePeople/civisualize.git
You can also download a zip file from
https://codeload.github.com/TechToThePeople/civisualize/zip/master
and extract in your extension directory. The next step is enabling the extension which can be done from "Administer -> Customize -> Manage CiviCRM Extensions".
The list of available visualizations is available at yoursite.org/civicrm/dataviz. Some of the currently available visualizations include
-
####Contributions (/dataviz/contribute)
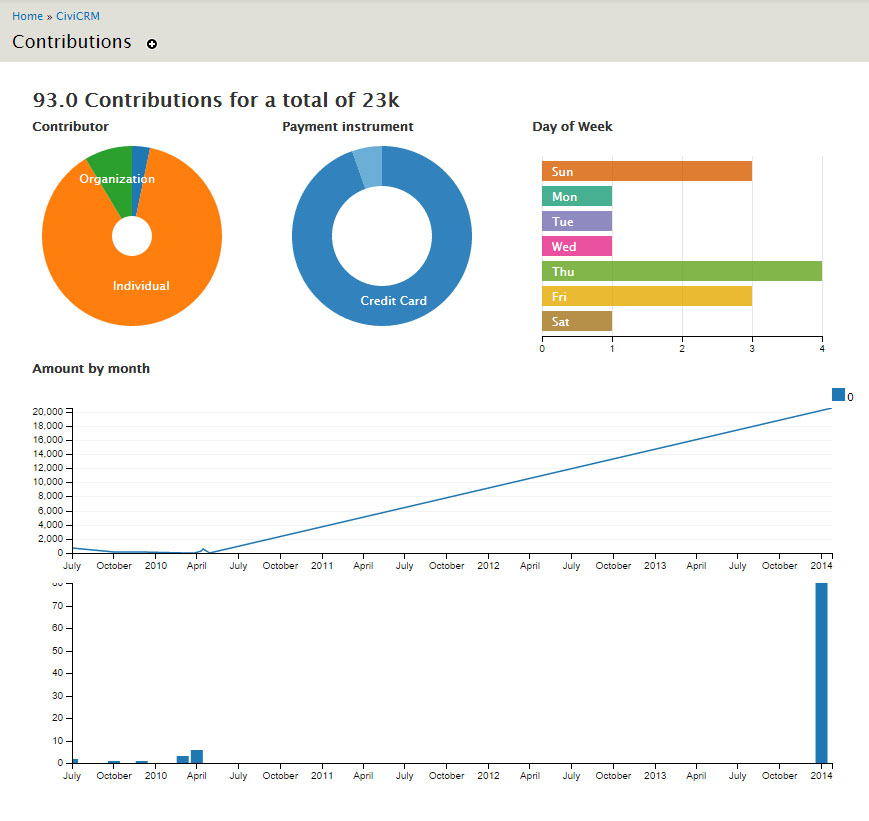 This provides an overview of contributions, type of contributors, the day of week the contribution was made, payment instrument, etc.
 -
####Contacts (/dataviz/contacts)
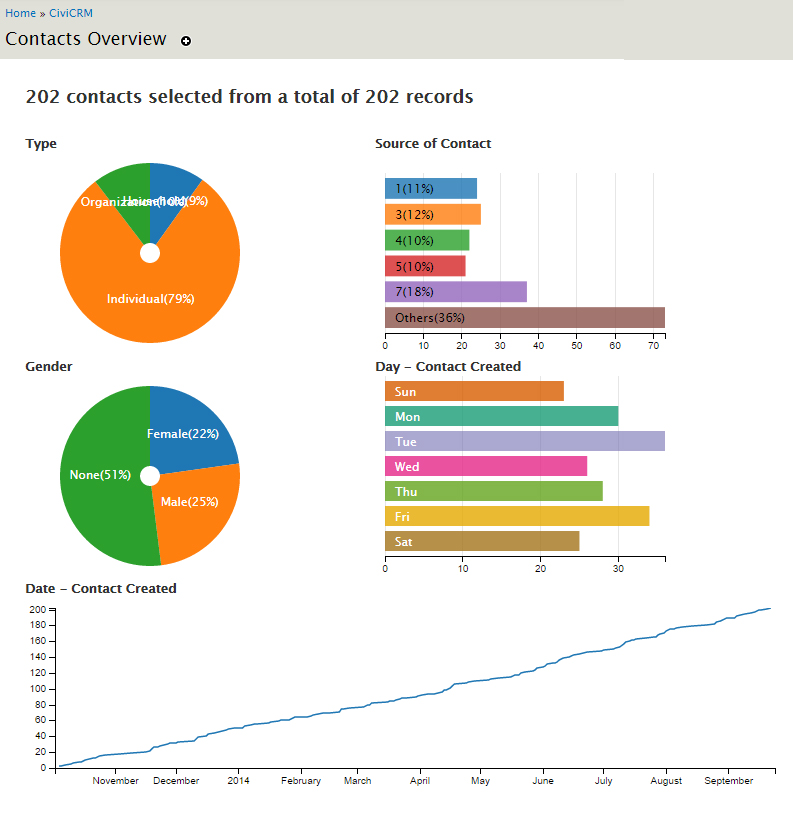 Contacts overview is a compilation of graphs showing types, gender, age, source of contact, contacts over the time etc.
 -
####Events (/dataviz/events)
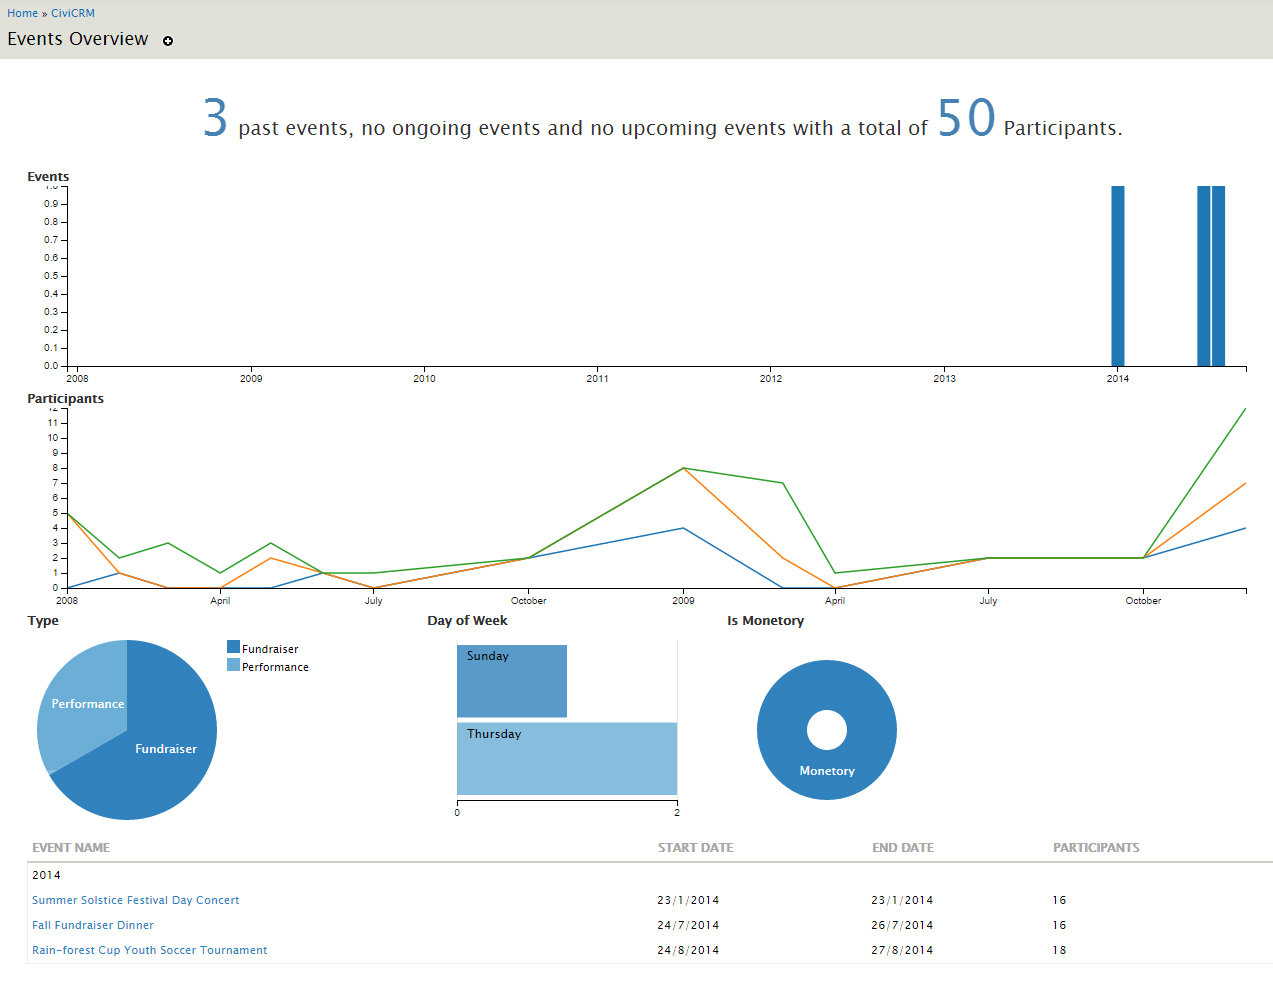 Events shows a lot of information about all the events of an organization and their participants. It shows events over time, participants over time, money generated from events, type of events, etc. It also displays a table listing all the events.
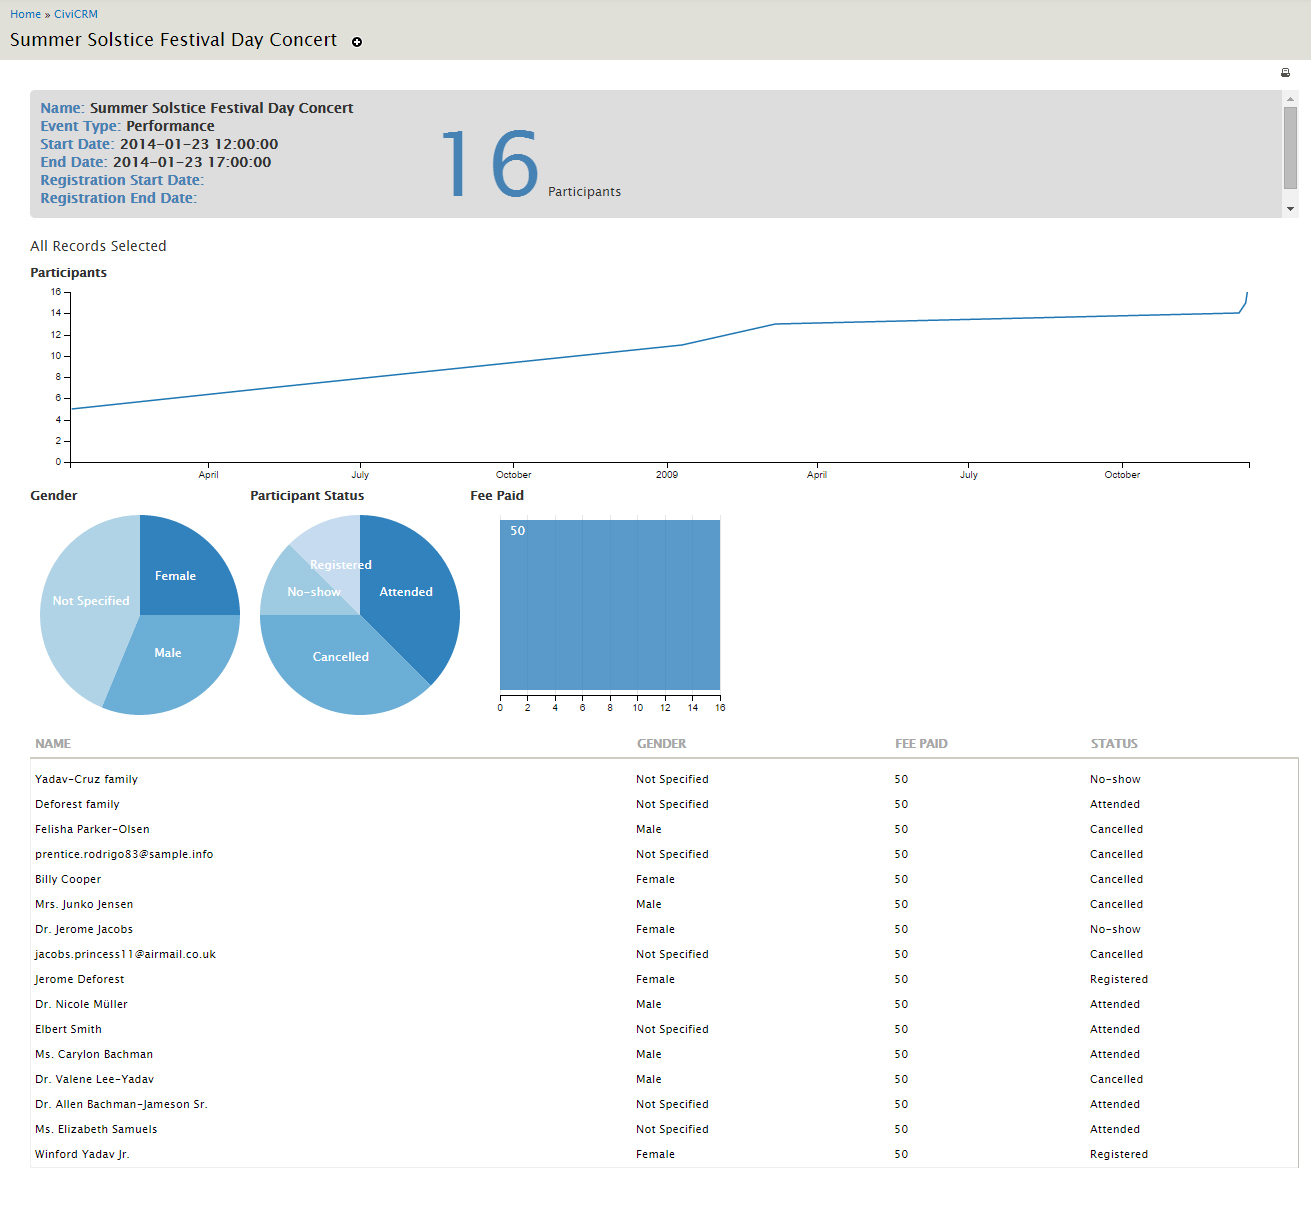
This table further links to specific event overview (/dataviz/event/) showing participants, their status, their fee etc.
-
####Donor Trends (/dataviz/donortrends)
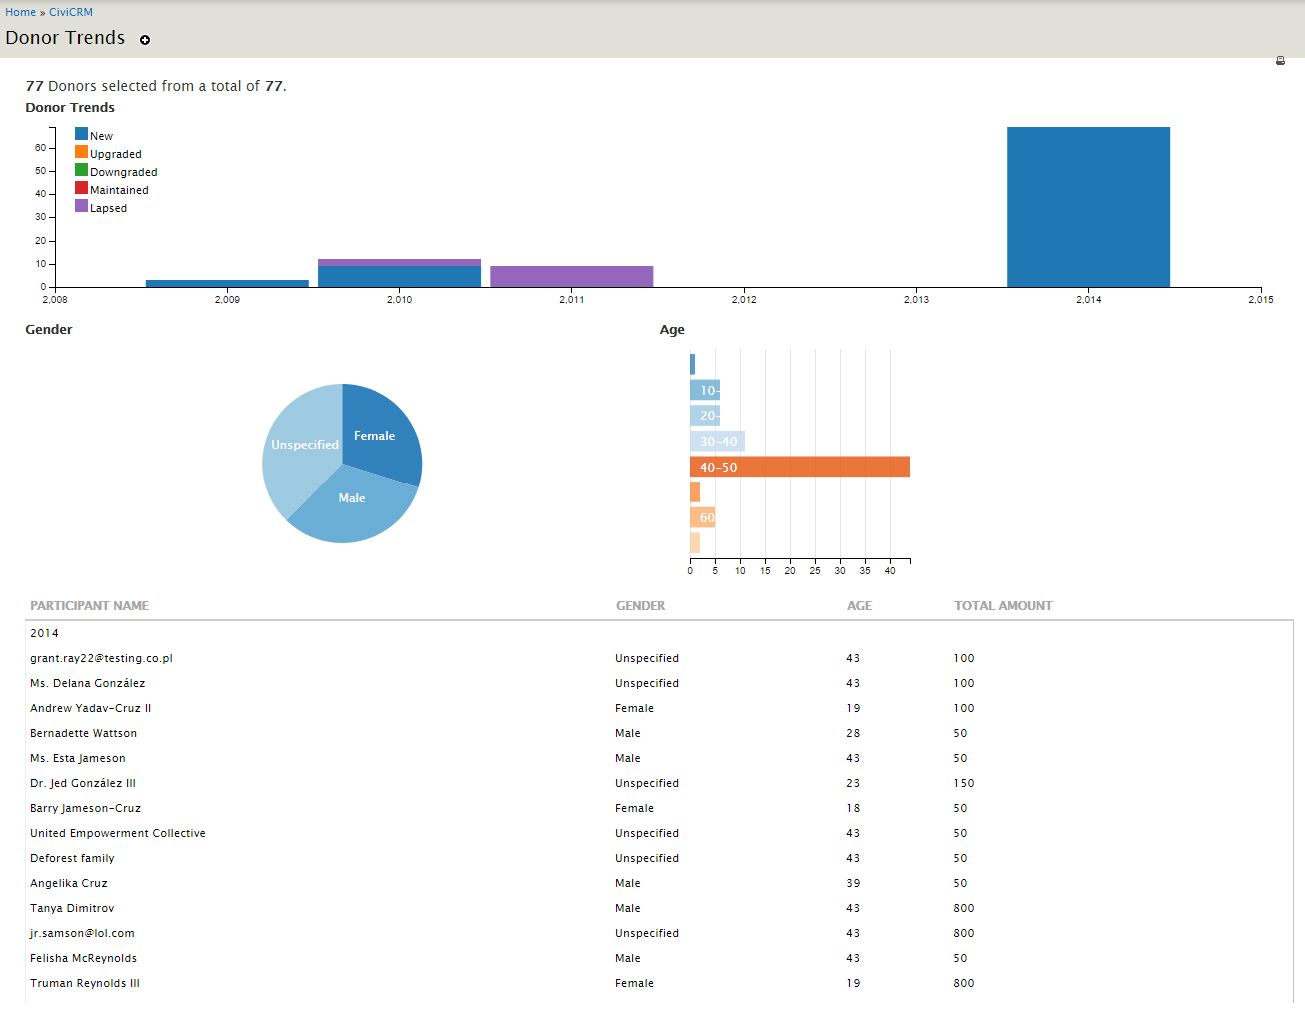 Based on the idea of CiviCRM Donor Trends Extension, the donor trends overview showcases a Bar Chart with new, lapsed, upgraded, downgraded and maintained donors over the years. This further showcases the gender and age of the donors and a list of all the donors.
Need not be mentioned, you can add more graphs and details to the above mentioned visualizations.
If you are a developer you can customize or create your extensions with a little knowledge of mysql/crmAPI, d3.js/dc.js and crossfilter. Civisualize basically has two parts
- Extract data from civiCRM
- Display data using dc.js/d3
###For the first part, we are using the following methods
-
####{crmAPI}
{crmAPI entity="OptionValue" option_group_id="14"}You can add getstat as a new action on some entities in the api.
-
####{crmSQL} We have added a new crmSQL to run a mySQL query. For obvious reasons crmSQL only let you run SELECT queries. You can get your data using any of the following three methods.
-
#####SQL String
{crmSQL sql="SELECT count(*) ... group by ...."} -
#####SQL File
{crmSQL query="somethingcool"}This will fetch the sql query from
/queries/somethingcool.sql -
#####JSON Object
{crmSQL json="somethingcooler" cid=4 bla="hello"}This will fetch a json object from
/queries/somethingcooler.jsonThe format of the json is{ "query":"SELECT * from ABC where id=%1 and bla=%2", "params":{ "1":{ "name":"cid", "type":"Integer"}, "2":{ "name":"bla", "type":"String"} } }
You can further use {crmRetrieve var="a" name="b" type="Integer"} This will assign the POST or GET variable named b into a, which can then be given to {crmSQL}
#####Optional Arguments {crmSQL set="varname"} will assign the result of the sql query to a smarty variable named varname
#####Return Value {crmSQL} returns a json of the following format
{"is_error":0,"error":"error_str","values":"Array of objects"}
so we primarily use {crmSQL}.values for our visualizations.
-
-
####{crmReport} A 3rd option is to be able to fetch data from a report instance using a {crmReport...}. Eileen has done (most of?) the work already. I think it's on 4.5
###Display data
The principle is to get the data in a template as a json, and apply dc on it until it looks awesome. You simply have to create a template into templates/dataviz/Something.tpl. Once you have the data from the above methods you can apply dc on it, and you can access it from http://yoursite.org/civicrm/dataviz/something
To get you started, you can visit http://yoursite.org/civicrm/dataviz/contribute or any of the above mentioned visualizations
This is using the wondefully magic dc, that is a layer of love on the top of d3 and crossfilter. Click on the graphs to filter down. magic, I told you. No matter if you use {crmAPI} or {crmSQL}, you end up with a json and a d3 and dc loaded and ready to rock
In the template, put
   <div id="theplacetograph"></div>
   <script>
     var mydata={crmAPI or crmSQL};
    {literal}
    d3("#theplacetograph").selectAll(...).data(mydata.values).domagic(...);
We have also used {crmTitle} function which let you set the title of the page, and a print_filter function that will help you in playing around with crossfilter.
Checkour resources at dc.js and create your first visualization.
xavier made this, sid helped him. You can find us on civicrm forum, @eucampaign and @sid0_o on twitter, or in the dc mailing group. Be warned, d3 is awesome, but the learning curve is steep. Worthwhile, the view at the top is beautiful.