Interface to display EEG signals and the synchronization between their electrodes. Created and developed as part of Télécom SudParis Cassiopée 2019-2020 project.
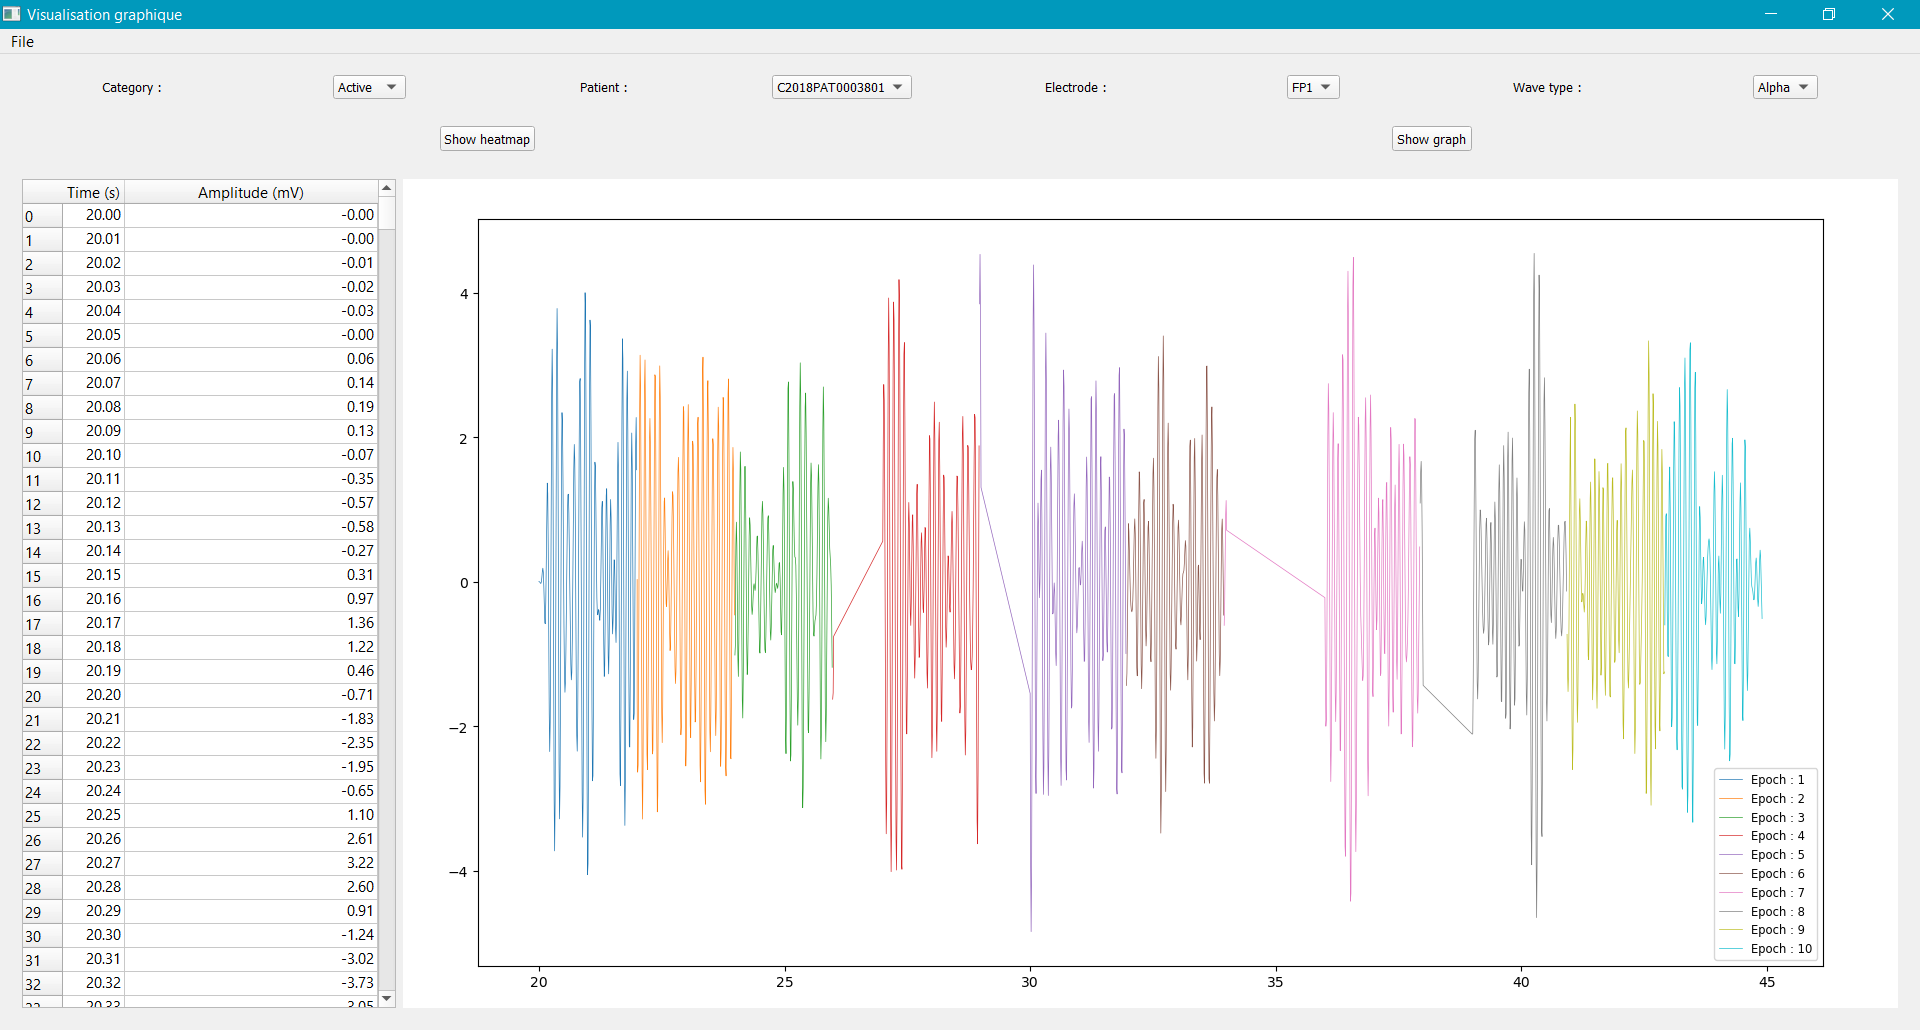
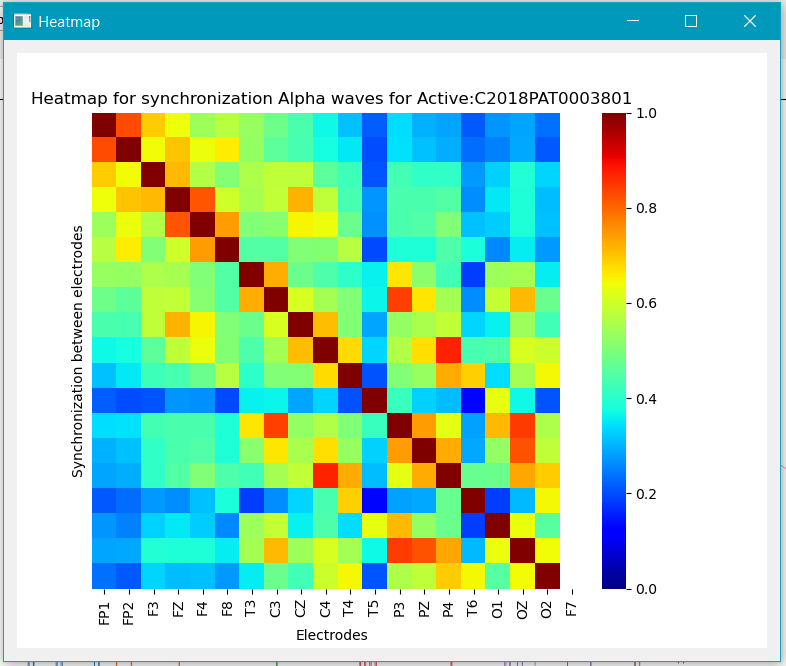
The purpose of this application is to enable the visualization of data from EEG signals. Either at the temporal level (y = f(t)), or at the level of synchronization between the different electrodes used for the measurement.
The interface supports matlab matrices of 20 or 30 electrodes.
To start the app launch main.py file in a python environment with the libraries below.
- PySide2 (design based on Qt)
- Matplotlib
- Numpy
- Scipy
- Seaborn
- xlrd & xlsxwriter (if you want use excel matrix)
- Calculate and display brain wave graphs according to different frequency ranges (alpha, beta, theta, delta).
- Customize frequency domain boundaries (alpha, beta, theta, delta).
- Display synchronization heatmaps between electrodes from synchronization matrices (PSC Matrix folder).
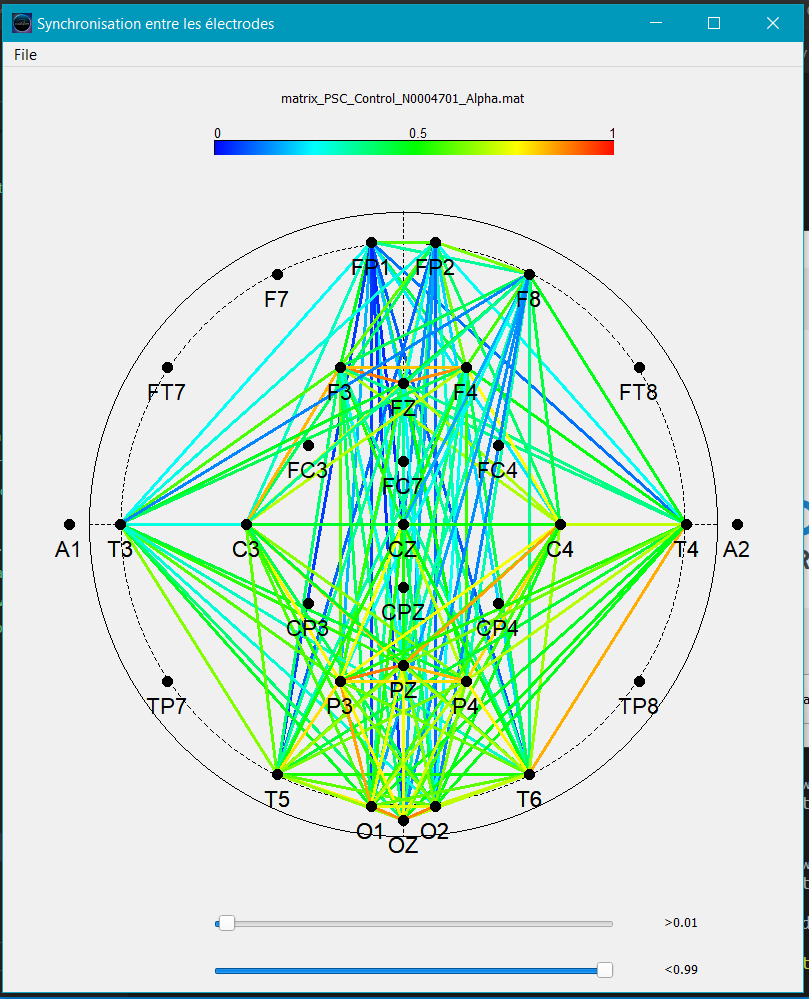
- Display a visualization (top view) of the synchronization between the different electrodes bases on PSC Matrices.
- Allow selection of a particular electrode synchronization band to be displayed.
- Assets : Contains all scripts et pics.
- Datas : Contains matrices of EEG signal.
35f2a16562cb0428c002a245c7daa6cd85542295