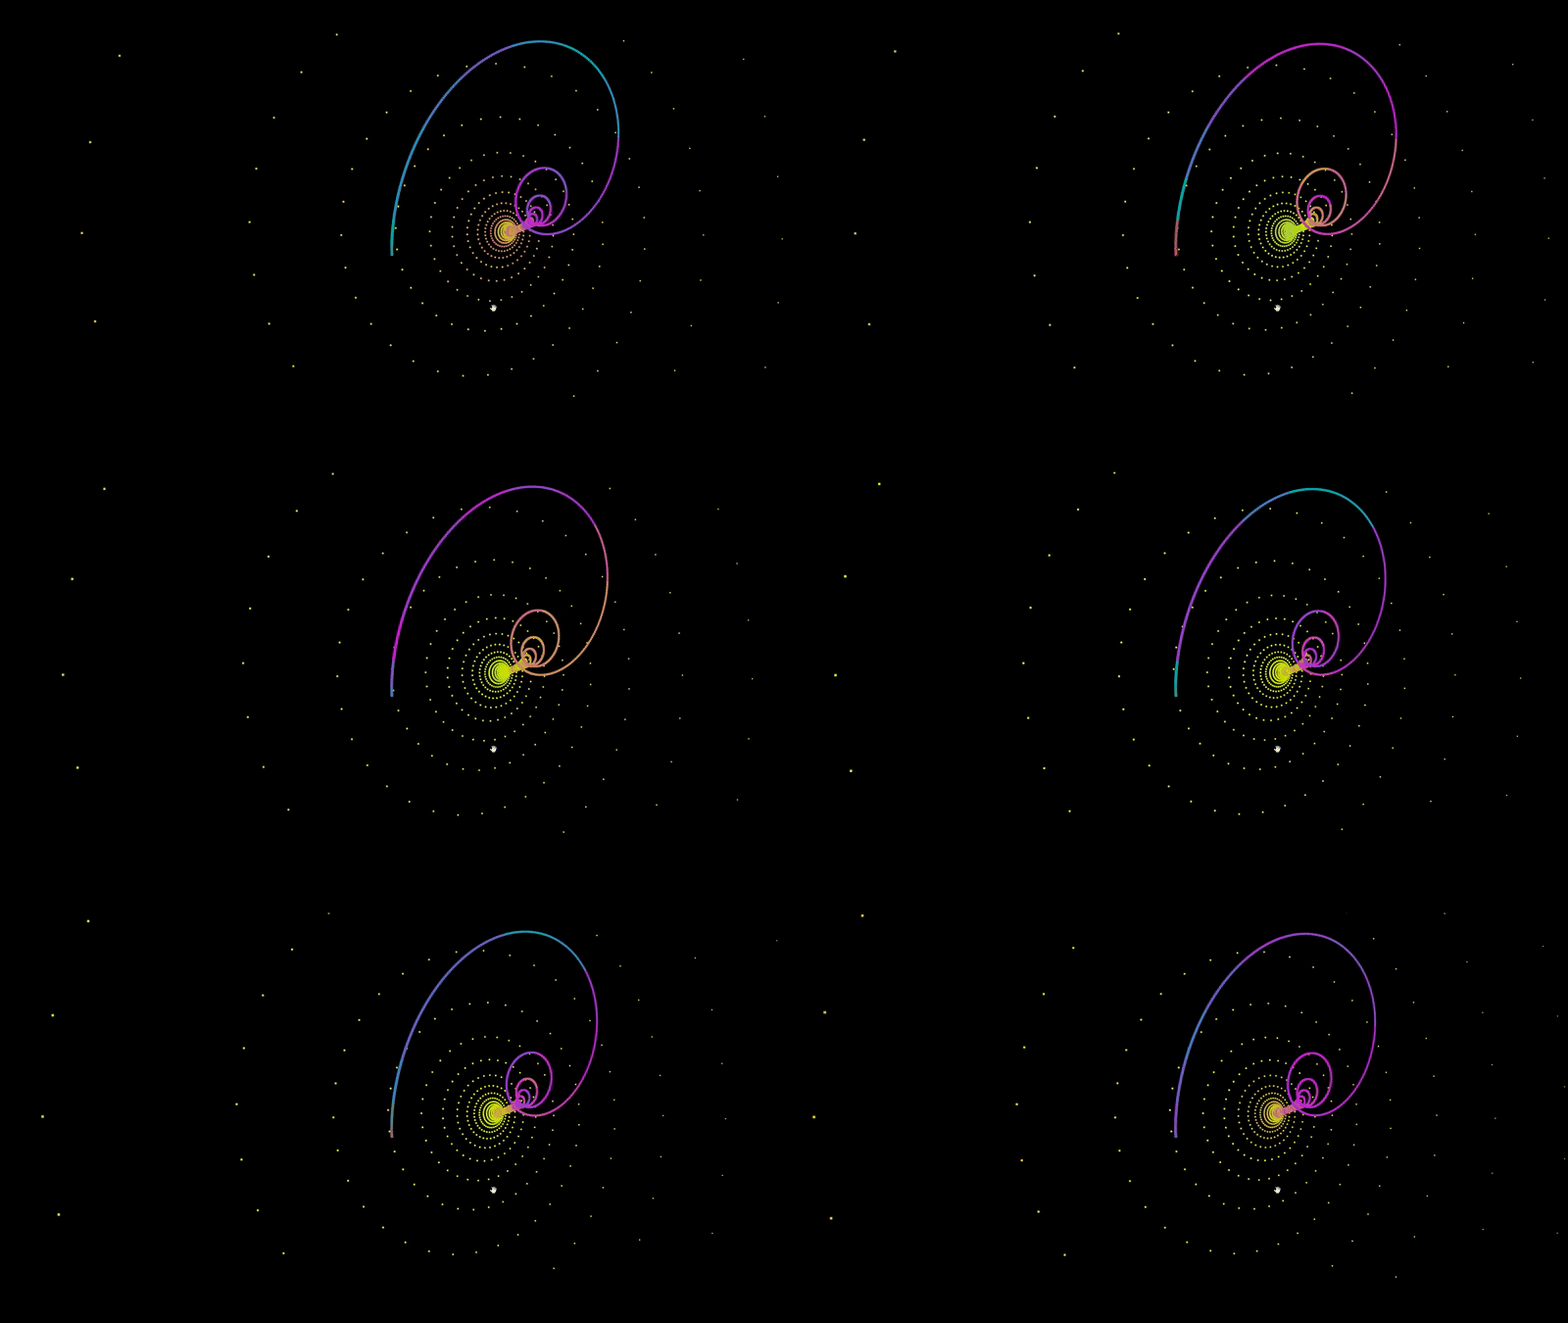
An A-Frame component for graphing audio responsive points.
Install and use by directly including the browser files:
<head>
  <title>My A-Frame Scene</title>
  <script src="https://aframe.io/releases/0.8.2/aframe.min.js"></script>
  <script src="https://unpkg.com/aframe-fractal-component/dist/aframe-fractal-component.min.js"></script>
</head>

<body>
  <a-scene>
    <a-entity fractal="foo: bar"></a-entity>
  </a-scene>
</body>Install via npm:
npm install aframe-fractal-componentThen require and use.
require('aframe');
require('aframe-fractal-component');| Property | Type | Default | Description |
|---|---|---|---|
| audioSource | selector/attribute | * | A-Sound element. |
| fftSize | int | 256 | A non-zero power of two up to 2048, representing the size of the FFT. |
| colors | array | '#f4ee42', '#41f468', '#41dff4' | Array of colors used to describe the frequency. |
| points | int | 100 | Number of points to be plotted. |
| pointSize | int | 1 | Size of individual points. |
| detail | int | 100 | How many material objects to use. |
| scale | int | 1 | The coordinates of each point will be multiplied by this number. |
| logValues | boolean | false | Set to true to log the x, y, and z values of the points to the console. |
| x | string/javascript | t | The function used to determine the x axis of each point based on t. |
| y | string/javascript | t | The function used to determine the y axis of each point based on t. |
| z | string/javascript | t | The function used to determine the z axis of each point based on t. |
<a-sound src='src: url(../music/song.mp3)' position='0 0 -10' id='audio' autoplay='true'></a-sound>

<a-entity audioSource='#audio' fractal='points: 200; x: Math.sin(t) * (t^2); z: Math.sin(t^2);' position='0 140 0' rotation='0 0 180'></a-entity>To plot a set of points, you have define f(t) for x, y, and z. In the example at the top of this page I defined f(t) for z as Math.sin(t^2). For each 200 points, it will increment t by 1 and return the value of f(t) in the case of z.
Most attractors determine their values based on the coordinates of the last point. To access the last point that was plotted, simply include prev.x, prev.y, or prev.z in your f(t) function.


