| title | layout |
|---|---|
Lecture 13 |
lecture |
- Having issues with uploading notebooks that will be corrected.
- Next week: we will be presenting in groups!
- Order to be announced by end of this week, once all groups are in.
An interesting article from this Cindy Xiong on Medium discusses the "curse of expertise" in data visualization.
Last week we covered the very basics of d3.js, using observablehq.com.
Review topics:
- Creating a canvas
- Adding items to the canvas
- Positioning items
const svg = d3.create("svg")
  .attr("width", 300)
  .attr("height", 300);

yield svg.node();var dataset = [
{x1: 1.0, y1: 3.0, x2: 3.5, y2: 2.0, radius: 10},
{x1: 2.5, y1: 2.0, x2: 0.75, y2: 3.5, radius: 5},
{x1: 3.1, y1: 0.6, x2: 4.1, y2: 3.4, radius: 25}
];
svg.selectAll("circle")
.data(dataset)
.enter()
.attr("cx", d => xScale(d.x1))
.attr("cy", d => yScale(d.y1))
.attr("r", d => d.radius)
.style("fill", "black");var xScale = d3.scaleLinear().range([0, 100]).domain([0.0, 1.0]);We will cover other scales later today.
There are many events that we can "listen" for, and respond to. For instance, the click event is a common event to manage.
The function receives the data (if any), the index of the node, and the nodelist.
d3.selectAll("circle")
  .on("click", (d, i, n) => {
    d3.select(n[i]).attr("r", 100)
});We can also update items through transitions, which can accept both a delay and a duration, both specified in milliseconds.
d3.selectAll("circle")
  .data(dataset)
  .transition()
  .duration(2000)
  .attr("x", d => d.x + 2)
Updating attributes utilizes "tween"-ing functions for interpolation. Many are built in, but you can choose to build your own.
There are ways to get data into observable. The simplest is to use await on an asynchronous loading function, like this:
var near_earth = await d3.json("https://data.nasa.gov/resource/2vr3-k9wn.json");
(More ideas at https://github.com/jdorfman/awesome-json-datasets )
You can specify HTML as well, and then modify that in code. This does not always require that you yield nodes.
html`<p id="my_hi">hi there</p>`
These can be selected by d3 as well.
In fact, we can modify any item in the DOM, not just SVG elements. Can we modify this paragraph?
SVG specifies a number of possible transformations. These include rotation, translations, skews and scales. We can set these through the .attr call, but note that this requires a bit of string manipulation.
svg.selectAll("circle").attr("transform",
    (d, i) => "skewY(" + i*5 + ")");
Note that we're concatenating an integer to a string here, which casts the int to a string. This is a bit non-intuitive.
We can use this to reshape our objects in many different ways -- especially using the index of the data point!
D3 provides a number of different scaling types. We will be discussing, specifically, banded scales and color scales.
One thing to note is that d3 also provides handy functions for computing properties of arrays. For instance:
d3.min,d3.max,d3.minIndexandd3.maxIndex, all of which accept both an iterable and an "accessor" function.d3.extent, which provides the format required by a scale.d3.sum,d3.mean,d3.median,d3.quantil,d3.variance
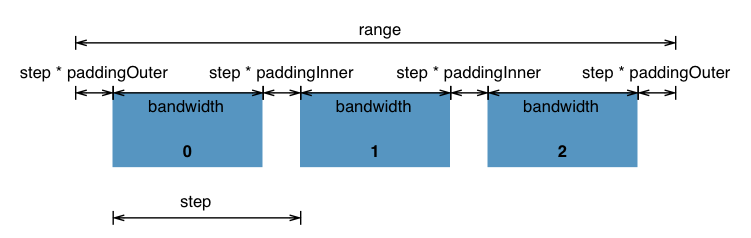
Banded scales provide discrete categorization of values, often used for categorical data.
var band = d3.scaleBand(["low", "medium", "high"], [0.0, 100.0]);This takes an array of input values for the domain. Additional changes can be made to the bandwidth, padding, etc. The d3 wiki has a
diagram describing this.
We can use d3.scaleSequential to generate colormaps for continuous values. These accept an interpolator function. d3 provides interpolator functions for many common colormaps. For instance:
var csc = d3.scaleSequential(d3.interpolateViridis).domain([1.0, 100.0])We can also use log versions of these, and quantized versions.
Brushing in d3 requires some build-it-yourself effort, but building a brush object itself is straightforward. You create a brush object with extents, and you call that on your object. Here, brushed is a function to be called when the brush selection changes.
function brushed() {
  console.log(d3.event.selection);
}

var brush = d3.brush()
              .extent([[0.0, 0.0], [512, 512]])
              .on("brush", brushed);
svg.append("g").attr("class", "brush").call(brush);
What could we do with this?
d3 can also generate path objects. Typically these are generated using curve
generators.
var line = d3.line().curve(
            d3.curveCatmullRom.alpha(0.5));
var myPath = svg.append("path")
              .attr("d", line(myPoints))
              .attr("stroke", "black");
Interpolation of paths can be tricky, but it is possible.
Let's build a near-earth object explorer.
- Sketch out a design in groups
- Discuss as a class the different designs
- Build as a class
Now how do we export this to a webpage?