| title | layout |
|---|---|
Lecture 5 |
lecture |
- What is the visualization trying to show?
- What are its methods?
- What are the strengths / weaknesses?
http://www.vijayp.ca/movies/new_page.html
- Transformations
- Colors
- Color mapping
- Data Characteristics
- Choosing Visualizations
Affine transformations satisfy:
$ \vec{y} = A\vec{x} + \vec{b} $
Affine transformations satisfy:
$ \vec{y} = A\vec{x} + \vec{b} $
We can use these to accomplish:
- Shifts
Affine transformations satisfy:
$ \vec{y} = A\vec{x} + \vec{b} $
We can use these to accomplish:
- Shifts
- Rotations
Affine transformations satisfy:
$ \vec{y} = A\vec{x} + \vec{b} $
We can use these to accomplish:
- Shifts
- Rotations
- Scaling
When we are examining data, what can we look for?
- Does this data describe a geometric object?
- Are the data points connected to each other?
- Can we describe data points with a fixed set of categories?
- Is there a quantity associated with the data?
- Are the datapoints continuous along one or more dimensions?
Today we'll talk about representing things based on categories and based on continuities.
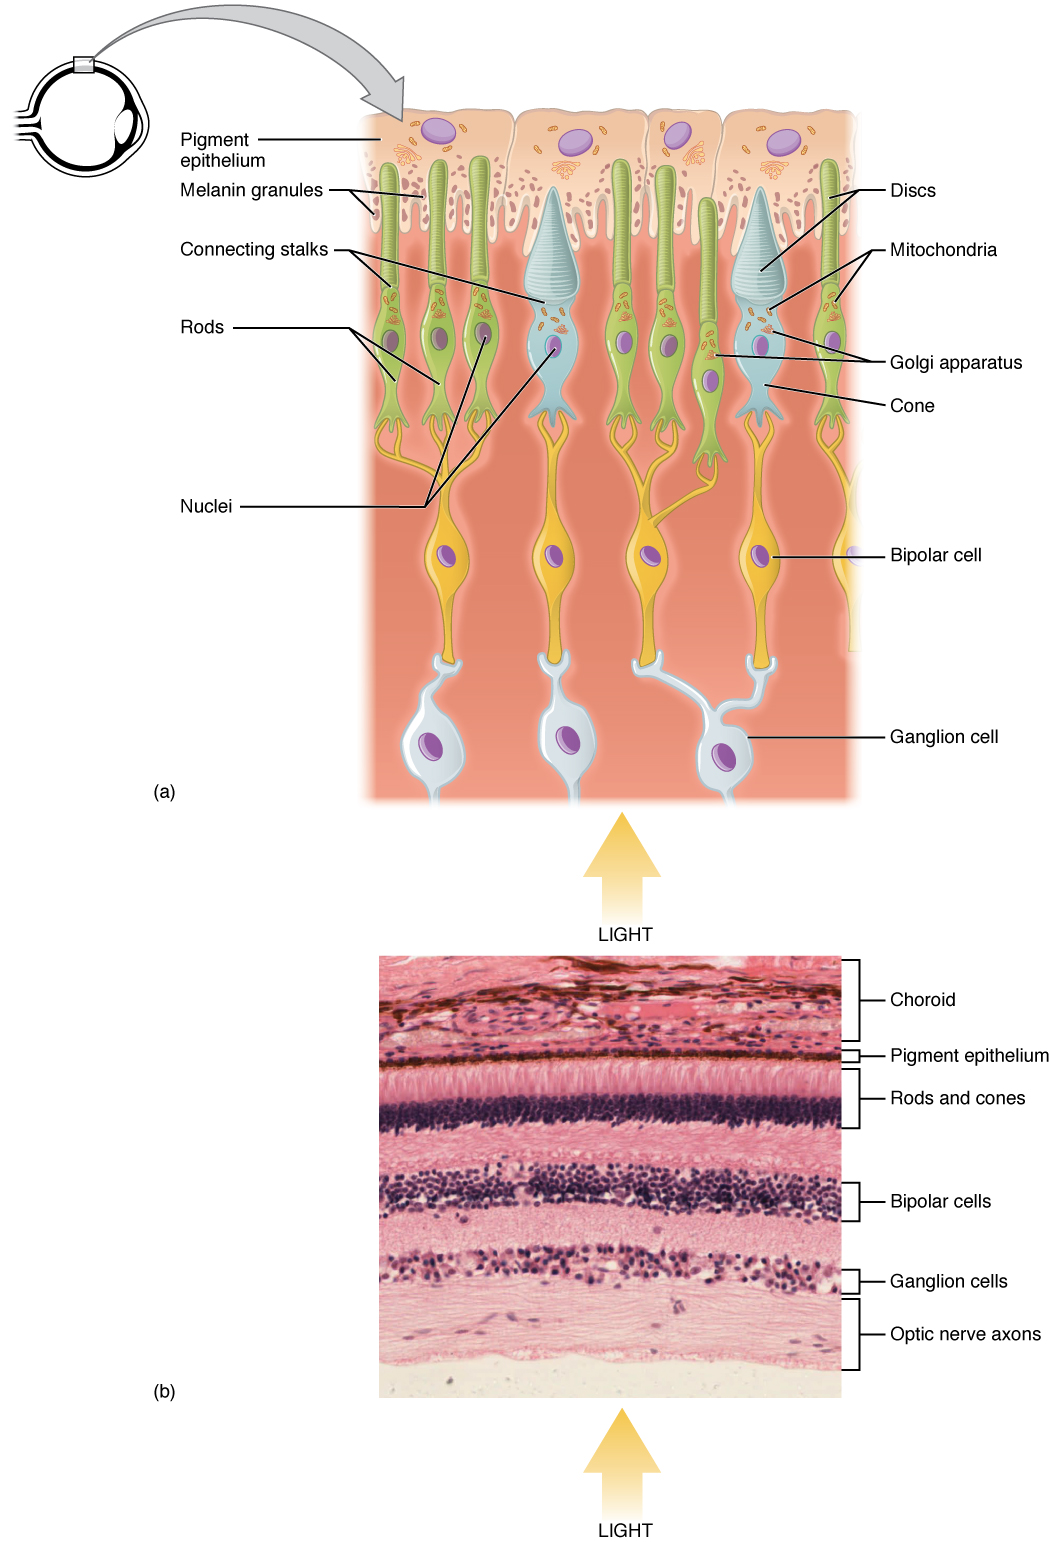
Rods (low-light) and cones (color) mediate vision. Humans have about 20 times as many rods (120 million) as cones (6 million).
https://upload.wikimedia.org/wikipedia/commons/e/e8/1414_Rods_and_Cones.jpg By OpenStax College CC BY 3.0, via Wikimedia Commons
http://enchroma.com/test/instructions/
- Colorbrewer Categories
- Sequential
- Diverging
- Qualitative
- Resources:
- colorbrewer.org
- palettable (package)


(See? Works better as discrete!)
https://commons.wikimedia.org/wiki/File:16777216colors.png
https://commons.wikimedia.org/wiki/File:HSV_color_solid_cylinder.png
By HSV_color_solid_cylinder.png: SharkD derivative work: SharkD Talk [CC BY-SA 3.0 (http://creativecommons.org/licenses/by-sa/3.0) or GFDL (http://www.gnu.org/copyleft/fdl.html)], via Wikimedia Commons
Assign each value to a specific color or element.
We can also re-map:
For instance, with logs or squares.
We map from a range of values to (0, 1):
$ v' = (v - v_0)/(v_1 - v_0) $
- The
importstatement loads and makes accessible - Python will search paths to find the script to import
sys.pathis a list of these- Current directory may or may not be included
- Modules are reusable collections of functions and scripts
- The presence of an
__init__.pyfile indicates something is a package - We will be building a module