Skip to content
New issue

Have a question about this project? Sign up for a free GitHub account to open an issue and contact its maintainers and the community.

By clicking “Sign up for GitHub”, you agree to our terms of service and privacy statement. We’ll occasionally send you account related emails.

Already on GitHub? Sign in to your account

Xarray + CF + CartoPy Projection Handling #786

Merged
merged 10 commits into from May 15, 2018

Conversation

dopplershift
Copy link
Member

@dopplershift dopplershift commented Mar 23, 2018

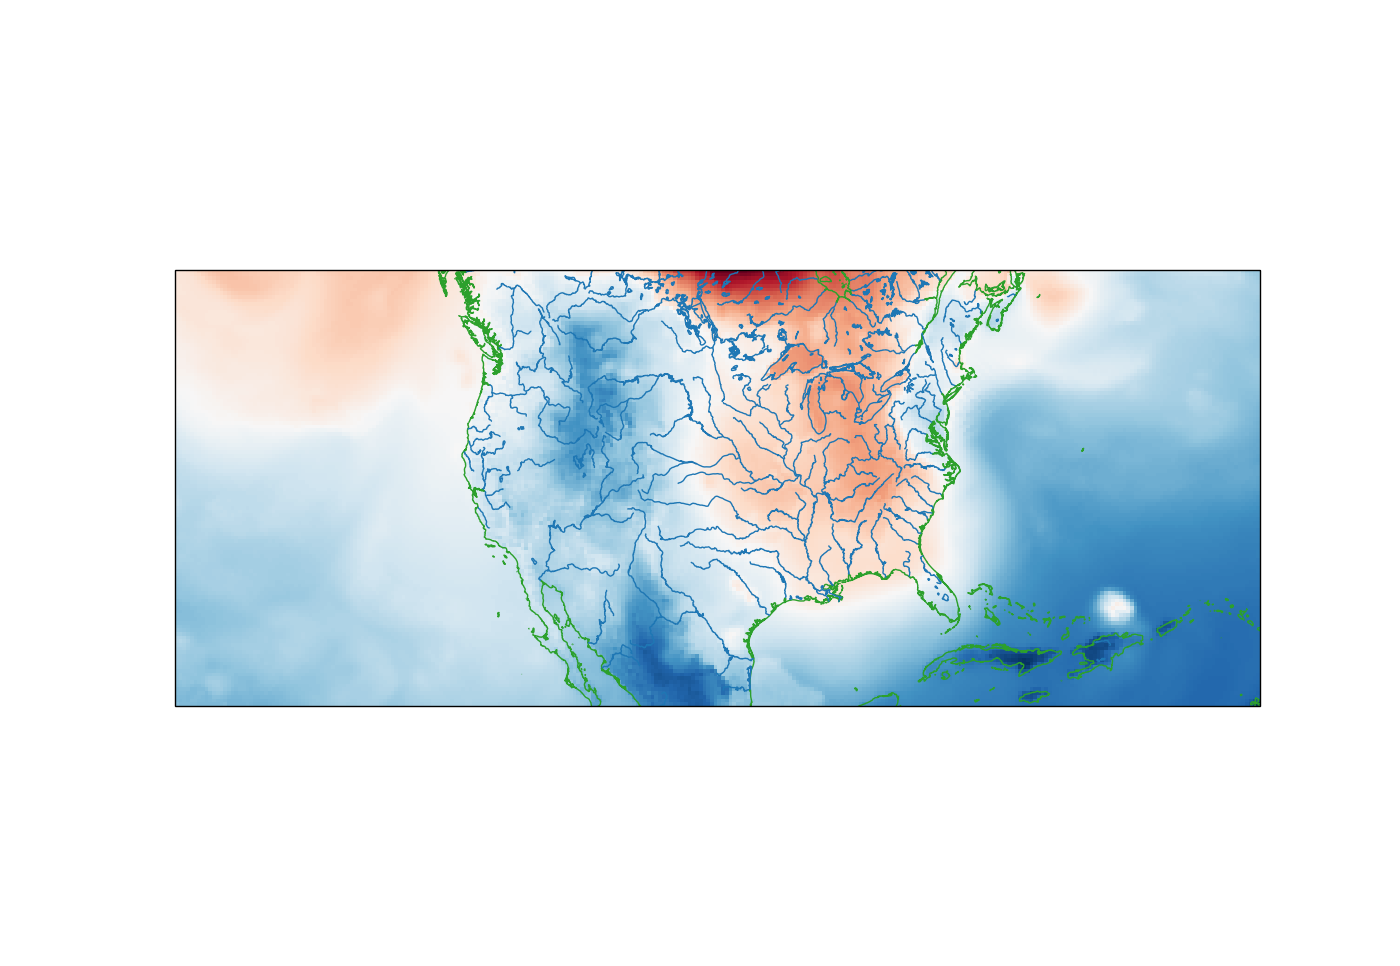
Here's a first cut at automatically decoding CF projection information using an XArray accessor and making it available conveniently as a CartoPy projection. There are no docs or tests yet, but there is an example using our NARR test data set.

Open questions:

  1. Naming and organization of everything
  2. Should we require manually activating the XArray accessors (using a function call). A benefit of this would be making sure we only initialize them once.
  3. Anything else labelled TODO
  4. What about providing some easy way to figure out what the x coordinates, etc. are?

To save everyone the trouble of downloading to try it out (though please do!), here's what the example looks like:

import cartopy.feature as cfeature
import matplotlib.pyplot as plt
import xarray as xr

import metpy.io.xarray  # To ensure accessors are available
from metpy.testing import get_test_data

ds = xr.open_dataset(get_test_data('narr_example.nc', as_file_obj=False))
data_var = ds.parse_cf('Temperature')

x = data_var.x
y = data_var.y
im_data = data_var.isel(time=0).sel(isobaric=1000.)

fig = plt.figure(figsize=(14, 14))
ax = fig.add_subplot(1, 1, 1, projection=data_var.cf.cartopy_crs)

ax.imshow(im_data, extent=(x.min(), x.max(), y.min(), y.max()),
          cmap='RdBu', origin='lower' if y[0] < y[-1] else 'upper')
ax.coastlines(color='tab:green', resolution='10m')
ax.add_feature(cfeature.LAKES.with_scale('10m'), facecolor='none', edgecolor='tab:blue')
ax.add_feature(cfeature.RIVERS.with_scale('10m'), edgecolor='tab:blue')

plt.show()

And the result:
figure_1

I've tested this locally with quite a few data sets. Everything coming from GOES-16 (both NOAAPORT and GRB) works fine. Many GRIB2 datasets work fine, with the exception of WW3 and MRMS; those failures are not related to the projection stuff. NARR, HRRR, NAM Alaska, and RTMA Guam are working fine.

import matplotlib.pyplot as plt
import xarray as xr

import metpy.io.xarray # To ensure accessors are available

Choose a reason for hiding this comment

The reason will be displayed to describe this comment to others. Learn more.

F401 'metpy.io.xarray' imported but unused

except KeyError:
import warnings
warnings.warn(
'Could not find variable corresponding to the value of grid_mapping: {}'.format(

Choose a reason for hiding this comment

The reason will be displayed to describe this comment to others. Learn more.

E501 line too long (100 > 95 characters)

def _fixup_coords(self, var):
for coord_name, data_array in var.coords.items():
if data_array.attrs.get('standard_name') in (
'projection_x_coordinate', 'projection_y_coordinate'):

Choose a reason for hiding this comment

The reason will be displayed to describe this comment to others. Learn more.

E122 continuation line missing indentation or outdented

except DimensionalityError: # Radians!
new_data_array = data_array.copy()
scaled_vals = new_data_array.units.array * (var.coords['crs'].item()[
'perspective_point_height'] * units.meters)

Choose a reason for hiding this comment

The reason will be displayed to describe this comment to others. Learn more.

E126 continuation line over-indented for hanging indent
E501 line too long (111 > 95 characters)

@lesserwhirls
Copy link
Contributor

He's a witch!

wizardry

@dopplershift
Copy link
Member Author

I wouldn't mind comments from @shoyer and @jhamman regarding the implementation of the xarray accessors, if you guys have a free cycle or two.

@eliteuser26
Copy link
Contributor

Hi @dopplershift did you find a way to read a Grib file? I have been reading anything related to Grib format, decoding it, using struct and Xarray. I have been trying to find a solution to decode in pure python. Looks like you have been looking at the same thing. I want to decode Canadian Grib files as well. I might be using your solution.

@Unidata Unidata deleted a comment from eliteuser26 Mar 26, 2018
@dopplershift
Copy link
Member Author

@eliteuser26 I think we'll be implementing something sooner rather than later since we're participating in the efforts for the next GRIB standard. Keep an eye on #411 and any related PRs. This particular PR is focused just on decoding projection information that complies with the netCDF-CF standard into proper CartoPy objects.

@CFProjection.register('latitude_longitude')
def make_latlon(attrs_dict, globe):
# TODO: 180 here needs to be determined by longitude?
# return ccrs.PlateCarree(globe=globe, central_longitude=180)

Choose a reason for hiding this comment

The reason will be displayed to describe this comment to others. Learn more.

E115 expected an indented block (comment)

@dopplershift
Copy link
Member Author

dopplershift commented Mar 26, 2018

Ok, new challenge: PlateCarree breaks down when you pass in a custom globe--because it's a hack around using equidistant cylindrical and a globe with a magical radius value. The proper projection is Geodetic, which maps to proj.4's lonlat. Unfortunately, Geodetic is not a map projection, so it can't be used as the projection for an Axes. 😭 Options:

(cross ref SciTools/cartopy#709 for PlateCarree specialness)

  1. "Adjust" the coordinates for lon/lat projections to be in meters appropriate for PlateCarree with a real globe.
  2. Use Geodetic and make plotting code live with the distinction (probably with a helper function)
  3. Add separate attributes for crs and native_map_projection since those are distinct concepts.

After writing this up, I think I lean towards (3). The downside is that proper use then requires passing native_map_projection when creating a plot, but needing to pass crs as the transform to every matplotlib plot command for true correctness. 😒 Edit: Well, I guess once we get to the point of wanting maps in custom projections, we need to be passing proper info for transform, so that's probably ok.

There's an additional challenge where CartoPy seems to work poorly with longitudes that are in [0, 360] rather than [-180, 180], but that's a separate issue--and more easily worked around.

(ping @deeplycloudy who has some experience in thinking about projections and may be interested in this PR in general.)

@CFProjection.register('latitude_longitude')
def make_latlon(attrs_dict, globe):
# TODO: 180 here needs to be determined by longitude?
# return ccrs.PlateCarree(globe=globe, central_longitude=180)

Choose a reason for hiding this comment

The reason will be displayed to describe this comment to others. Learn more.

E115 expected an indented block (comment)

@dopplershift
Copy link
Member Author

Follow up: imshow() does not like being given an instance of Geodetic either.

@eliteuser26
Copy link
Contributor

When using openlayers I did come across the issue of using -180 to 180 degree of longitude when displaying polygons. When a point fell outside the 180 degree of longitude boundary it created an artifact where the point was on the other side of the globe. However I did find a solution that resolve this issue by using 0 to 360 degree of longitude east or west. And it worked like a charm.

@dopplershift
Copy link
Member Author

@eliteuser26 Right. Another option is to specify the central longitude of the PlateCarree projection so that your data fall inside the standard bounds of the projection (without wrapping). The question is how to make this stuff work in the general case--and I wonder if it's something that CartoPy should be handling better.

@deeplycloudy
Copy link
Collaborator

I always thought something seemed fishy about the common use of PlateCaree for this purpose.

When I think about problems like this I always think about explicitly transforming lon/lat/alt (specified with respect to a globe) to a target coordinate system before plotting, which sounds like (2) above. If you don't have the third coordinate, just set alt=0.

It seems CartoPy requires a projection be 2D for it to be drawable, for obvious reasons. However, this behavior causes problems because it is a degenerate way to treat geospatial coordinates - the problem is fundamentally 3D, and includes a vertical coordinate with respect to the plane of the projection. proj.4 handles everything in 3D under the hood, and you can say "my coords are lon/lat/alt and I want to go to this map projection" in one line — and latlong is a valid projection, just like 'lcc' in proj.4.

ellipse = datum = 'WGS84'
lonlat_cs = proj4.Proj(proj='latlong', ellps=ellipse, datum=datum)
lcc_cs = proj4.Proj(proj='lcc', ellps=ellipse, datum=datum)
x, y, z = proj4.transform(lonlat_cs, lcc.cs, lon, lat, alt)

Why not write a Projection for CartoPy that takes lon/lat/alt and does the right thing with proj.4?

One could also amend CartoPy to make the Projection class 3D, and then use the first two coordinates when doing the draw operation.

For reference, my coordinate systems approach is here. I round-trip everything through earth-centered earth-fixed.
https://github.com/deeplycloudy/lmatools/blob/master/coordinateSystems.py

And there is an example going from lon/lat/alt to GOES fixed grid with the GRS80 globe at
https://github.com/deeplycloudy/lmatools/blob/master/testing/test_coords.py

@eliteuser26
Copy link
Contributor

That is exactly what I was doing with Openlayers as an example where I did the transformation from lon/lat to whatever projection before I did the plotting. This method worked quite fine this way. I am not sure yet how this could be done in Metpy or Cartopy. I will have to look deeper into it to find out if it is possible.

def make_latlon(attrs_dict, globe):
# TODO: 180 here needs to be determined by longitude?
# return ccrs.PlateCarree(globe=globe, central_longitude=180)
# return ccrs.Geodetic(globe=globe)

Choose a reason for hiding this comment

The reason will be displayed to describe this comment to others. Learn more.

E115 expected an indented block (comment)

@dopplershift dopplershift added Area: Infrastructure Pertains to project infrastructure (e.g. CI, linting) Type: Feature New functionality Area: Plots Pertains to producing plots Area: Projections Pertains to projecting coordinates between coordinate systems labels Mar 29, 2018
@deeplycloudy
Copy link
Collaborator

deeplycloudy commented Apr 3, 2018

I need to correct something I said above:

... the problem is fundamentally 3D, and includes a vertical coordinate with respect to the plane of the projection ...

Height above the plane of projection is wrong. It turns out that proj.4 uses the altitude from the lon/lat/alt tuple as the z coordinates in the map projection, at least when using proj4.transform.

Using my coordinate systems library, which is a thin wrapper on proj.4, I get the following:

In [7]: from lmatools.coordinateSystems import GeographicSystem, MapProjection

In [8]: lat, lon, alt = (33.5, 36.5), (-101.5, -98.0), (0.0, 0.0)

In [9]: geosys = GeographicSystem()

In [12]: mapsys = MapProjection(ctrLat=33.5, ctrLon=-101.5)

In [13]: mapsys.fromECEF(*geosys.toECEF(lon, lat, alt))
Out[13]: 
(array([      0.        ,  389618.21777646]),
array([      0.        ,  333958.47237982]),
array([  0.00000000e+00,   2.79396772e-09]))

In [14]: mapsys = MapProjection(projection='eqc',ctrLat=33.5, ctrLon=-101.5)

In [15]: mapsys.fromECEF(*geosys.toECEF(lon, lat, alt))
Out[15]: 
(array([      0.        ,  389618.21777646]),
array([      0.        ,  333958.47237982]),
array([  0.00000000e+00,   2.79396772e-09]))

In [16]: mapsys = MapProjection(projection='aeqd',ctrLat=33.5, ctrLon=-101.5)

In [17]: mapsys.fromECEF(*geosys.toECEF(lon, lat, alt))
Out[17]: 
(array([      0.        ,  585791.04021902]),
array([      0.        ,  219130.21737424]),
array([  0.00000000e+00,   2.79396772e-09]))

In [18]: mapsys = MapProjection(projection='lcc',ctrLat=33.5, ctrLon=-101.5)

In [19]: mapsys.fromECEF(*geosys.toECEF(lon, lat, alt))
Out[19]: 
(array([      0.        ,  440503.99771476]),
array([      0.        , -132356.13325572]),
array([  0.00000000e+00,   2.79396772e-09]))

In [20]: lat, lon, alt = (33.5, 36.5), (-101.5, -98.0), (10.0, 10.0)

In [21]: x,y,z=mapsys.fromECEF(*geosys.toECEF(lon, lat, alt))
Out[21]: print((x,y,z))
(array([  9.31322575e-10,   4.40503998e+05]),
array([  1.86264515e-09,  -1.32356133e+05]),
array([ 10.,  10.]))

In [26]: geosys.fromECEF(*mapsys.toECEF(x,y,z))
Out[26]: (array([-101.5,  -98. ]), array([ 33.5,  36.5]), array([ 10.,  10.]))

The relevant transform call in proj.4 is https://github.com/jswhit/pyproj/blob/master/src/pj_transform.c#L83

See also the note about vertical units at http://proj4.org/parameters.html#vertical-units

@dopplershift dopplershift added this to the 0.8 milestone Apr 12, 2018
@shoyer
Copy link

shoyer commented Apr 14, 2018

A few thoughts on these accessors from my perspective as an xarray maintainer:

  • Three accessors (units, cf and parse_cf) seemss like a lot. In general, acccessors should be thought of as a top-level namespace, so it's best to minimize the number the number of these to minimize potential conflicts. I would suggest putting everything under a single accessor if possible (e.g., .cf or .met for metpy) and using methods/properties on the one accessor to implement everything else (e.g., .cf.parse() and .cf.units).
  • I think it would be cleaner to handle units by adding a new extension system inside xarray for custom array types rather than using an accessor, but this will require some upstream work (Hooks for XArray operations pydata/xarray#1938).

@dopplershift
Copy link
Member Author

@shoyer Thanks for the feedback. Using a single namespace met or even metpy makes sense for me. Given that we need accessors for both DataArray and Dataset, with different capabilities, it seems that we still need at least two? Unless I'm missing something?

@shoyer
Copy link

shoyer commented Apr 16, 2018

Using a single namespace met or even metpy makes sense for me. Given that we need accessors for both DataArray and Dataset, with different capabilities, it seems that we still need at least two?

Sure, that makes sense, but you can probably give them the same name? e.g., Dataset.met and DataArray.met

Copy link
Contributor

@jrleeman jrleeman left a comment

Choose a reason for hiding this comment

The reason will be displayed to describe this comment to others. Learn more.

So are we ready to fixup the little bot nits and get things green on this? An initial look over didn't have anything that jumped out.

import matplotlib.pyplot as plt
import xarray as xr

import metpy.io # To ensure xarray accessors are available

Choose a reason for hiding this comment

The reason will be displayed to describe this comment to others. Learn more.

F401 'metpy.io' imported but unused

@dopplershift dopplershift changed the title Xarray + CF + CartoPy Projection Handling [WIP] Xarray + CF + CartoPy Projection Handling May 11, 2018
jrleeman
jrleeman previously approved these changes May 11, 2018
Copy link
Contributor

@jrleeman jrleeman left a comment

Choose a reason for hiding this comment

The reason will be displayed to describe this comment to others. Learn more.

I think I'm good with this!

@dopplershift
Copy link
Member Author

@jrleeman Are we ok picking up a hard dependency on xarray?

@dopplershift
Copy link
Member Author

Actually, I think I can work around that.

@jrleeman
Copy link
Contributor

I'm actually fine with the dependency since we're committing on the data model.

@dopplershift
Copy link
Member Author

Not sure what Circle's deal is, but everything else looks good here. I think this is ready @jrleeman .

@dopplershift
Copy link
Member Author

Well...just looked at coverage and it seems there's a test line that wasn't getting hit. Which meant there was a problem in the codecov config.

Copy link
Contributor

@jrleeman jrleeman left a comment

Choose a reason for hiding this comment

The reason will be displayed to describe this comment to others. Learn more.

All happy now or still want to play with codecov?

"""Test that the registry properly registers functions."""
reg = Registry()

callback = lambda x: None

Choose a reason for hiding this comment

The reason will be displayed to describe this comment to others. Learn more.

E731 do not assign a lambda expression, use a def

This adds a class with a register decorator that can be used to register
callables under a string.
Default behavior of Python 2.7 gets confused by our having our own
xarray module and trying to import the main library. Some future imports
solve this...
Right now metpy.calc won't import without having pyproj installed, which
is a bit more of a pain in the but than I want for a hard dependency
right now.
Looks like we were missing some test lines
@dopplershift
Copy link
Member Author

I expect this to pass now. Assuming it does, go ahead and merge.

Copy link
Contributor

@jrleeman jrleeman left a comment

Choose a reason for hiding this comment

The reason will be displayed to describe this comment to others. Learn more.

LGTM

@jrleeman jrleeman merged commit 0b2edb3 into Unidata:master May 15, 2018
@dopplershift dopplershift deleted the xarray-projections branch May 15, 2018 05:20
Sign up for free to join this conversation on GitHub. Already have an account? Sign in to comment
Labels
Area: Infrastructure Pertains to project infrastructure (e.g. CI, linting) Area: Plots Pertains to producing plots Area: Projections Pertains to projecting coordinates between coordinate systems Type: Feature New functionality
Projects
None yet
Development

Successfully merging this pull request may close these issues.

None yet

7 participants