几何图形,BizCharts 中保留了 G2 提供的十多个几何图形,同时也支持用户通过 Shape 上的接口自定义几何图形。
自定义 Shape 的使用如下:
var Shape = BizCharts.Shape;
//往对应的 geomType 上注册名字为 shapeName 的 Shape
var shapeObj = Shape.registerShape('geomType', 'shapeName', {
  getPoints: function(pointInfo) {
    // 获取每种 shape 绘制的关键点
  },
  draw: function(cfg, container) {
    // 自定义最终绘制的逻辑
  }
});

ReactDOM.render((
 <Chart>
   //在对应 geomType 的 <Geom /> 中使用注册过的名字为 shapeName 几何图形
   <Geom type='interval' shape='shapeName' />
 </Chart>
), container)getPoints 方法用于计算绘制每种 shape 的关键点,在 G2 中每种几何形状都是由特定的几个关键点通过线连接而成。
getPoints 方法中传入的参数 pointInfo 数据结构如下,所有的数值都是归一化后的结果(即 0 至 1 范围内的数据):
{
  size: 0.1, // 形状的尺寸,不同的 shape 该含义不同,0 - 1 范围的数据
  x: 0.2, // 该点归一化后的 x 坐标
  y: 0.13, // 该点归一化后的 y 坐标
  y0: 0.1 // 整个数据集 y 轴对应数据的最小值,也是归一化后的数据,注意如果 y 对应的源数据是数组则 y 也将是个数组
}
下表列出了 G2 各个 geom 几何形状的关键点形成机制:
| geom 类型 | 解释 |
|---|---|
| point | 点的绘制很简单,只要获取它的坐标以及大小即可,其中的 size 属性代表的是点的半径。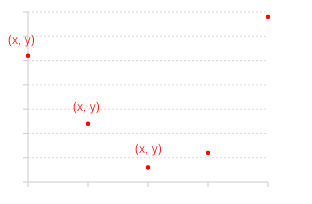 |
| line | 线其实是由无数个点组成,在 G2 中我们将参与绘制的各个数据转换成坐标上的点然后通过线将逐个点连接而成形成线图,其中的 size 属性代表的是线的粗细。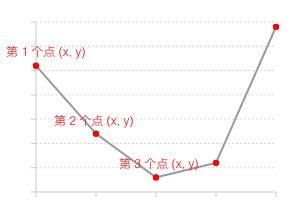 |
| area | area 面其实是在 line 线的基础之上形成的, 它将折线图中折线与自变量坐标轴之间的区域使用颜色或者纹理填充。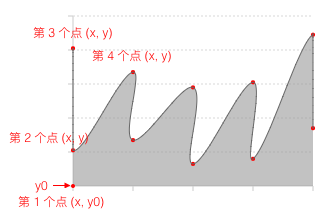 |
| interval | interval 默认的图形形状是矩形,而矩形实际是由四个点组成的,在 G2 中我们根据 pointInfo 中的 x、y、size 以及 y0 这四个值来计算出这四个点,然后顺时针连接而成。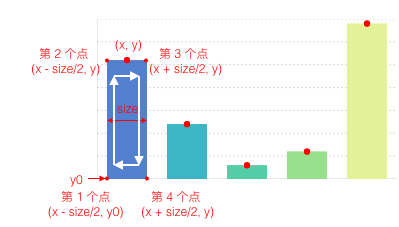 |
| polygon | polygon 多边形其实也是由多个点连接而成,在 pointInfo 中 x 和 y 都是数组结构。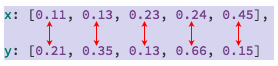 |
| schema | schema 作为一种自定义的几何图形,在 G2 中默认提供了 box 和 candle 两种 shape,分别用于绘制箱型图和股票图,注意这两种形状的矩形部分四个点的连接顺序都是顺时针,并且起始点均为左下角,这样就可以无缝转换至极坐标。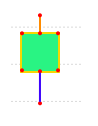 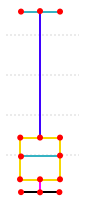 |
| edge | edge 边同 line 线一致,区别就是 edge 是一个线段,连接边的两个端点即可。 |
getPoints 用于计算绘制 shape 的关键点,那么 draw 方法就是用来定义如何连接这些关键点的。
cfg: object
该参数包含经过图形映射后的所有数据以及该数据对应的原始数据,结构如下图所示:
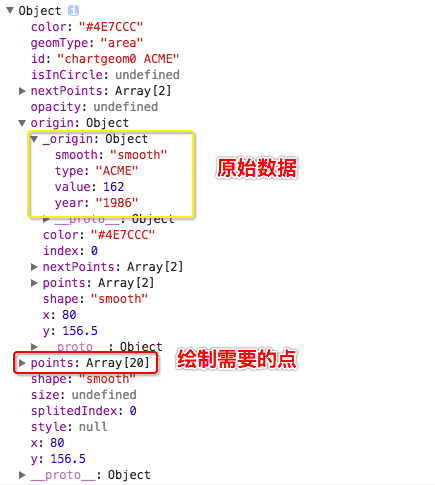
原始数据存储于 cfg.origin._origin 中,通过 getPoints 计算出的图形关键点都储存于 points 中。而 cfg 对象中的 color、size、shape 都是通过映射之后的图形属性数据,可以直接使用。
container: G2.G.Group
图形容器,需要将自定义的 shape 加入该容器中才能最终渲染出来。
另外我们还提供了一些工具类方法,帮助用户快速将归一化后的数据转换为画布上的坐标,使用的时候直接在上述两个方法内通过如下方式调用即可:
Shape.registerShape('interval', 'rect', {
  getPoints(pointInfo) {
    // ...
  },
  draw(cfg, container) {
    // ...
    path = this.parsePath(path);
    // ...
  }
});方法名: shapeObj.parsePoint(point)
说明:将 0 - 1 范围内的点转化为画布上的实际坐标。
point: object
结构如下:
{
  x: 0.3,
  y: 0.34
}方法名:shapeObj.parsePoints(points)
说明:将一组 0 - 1 范围内的点转化为画布上的实际坐标。
point: Array
结构如下:
[
  { x: 0.3, y: 0.34 },
  { x: 0.3, y: 0.34 }
]方法名:shapeObj.parsePath(path, isCircle)
说明:将形状的关键点连接之后形成的 path,如果依然是归一化后的数据的话,就可以调用该方法将其转化了画布上的坐标值。
path: String
连接各个关键的路径,例如:'M0 0C0,0,0.0315...5785,0,0.675,0,0.675z'。
isCircle: Boolean
是否是极坐标。如果是极坐标,该方法会自动进行转曲。
下面通过一个例子来加深下理解。
const Shape = G2.Shape;
Shape.registerShape('interval', 'triangle', {
  getPoints(cfg) {
    const x = cfg.x;
    const y = cfg.y;
    const y0 = cfg.y0;
    const width = cfg.size;
    return [
      { x: x - width / 2, y: y0 },
      { x: x, y: y },
      { x: x + width / 2, y: y0 }
    ]
  },
  draw(cfg, group) {
    const points = this.parsePoints(cfg.points); // 将0-1空间的坐标转换为画布坐标
    const polygon = group.addShape('polygon', {
      attrs: {
        points: [
          [ points[0].x, points[0].y ],
          [ points[1].x, points[1].y ],
          [ points[2].x, points[2].y ]
        ],
        fill: cfg.color
      }
    });
    return polygon; // 将自定义Shape返回
  }
});

const data = [
  { genre: 'Sports', sold: 275 },
  { genre: 'Strategy', sold: 115 },
  { genre: 'Action', sold: 120 },
  { genre: 'Shooter', sold: 350 },
  { genre: 'Other', sold: 150 }
];

const chart = new G2.Chart({
  id: 'c1',
  height : 300,
  forceFit: true,
});

chart.source(data);
chart.interval().position('genre*sold').color('genre').shape('triangle');
chart.render();
自定义 Shape 的完整代码如下:
const Shape = G2.Shape;
Shape.registerShape('interval', 'triangle', {
  getPoints(cfg) {
    const x cfg.x;
    const y = cfg.y;
    const y0 = cfg.y0;
    const width = cfg.size;
    return [
      { x: x - width / 2, y: y0 },
      { x: x, y: y },
      { x: x + width / 2, y: y0 }
    ]
  },
  draw(cfg, group) {
    const points = this.parsePoints(cfg.points); // 将0-1空间的坐标转换为画布坐标
    const polygon = group.addShape('polygon', {
      attrs: {
        points: [
          [ points[0].x, points[0].y ],
          [ points[1].x, points[1].y ],
          [ points[2].x, points[2].y ]
        ],
        fill: cfg.color
      }
    });
    return polygon; // 将自定义Shape返回
  }
});