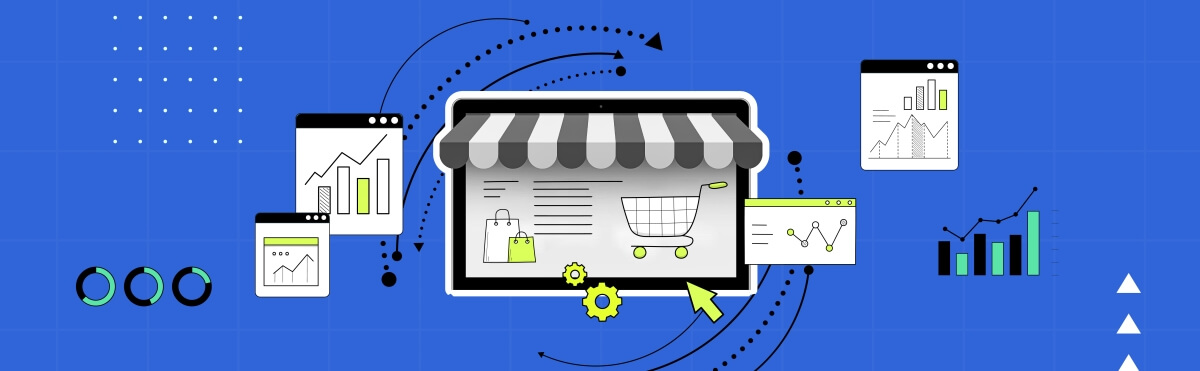
Ever wondered how big eCommerce sites like Amazon or Flipkart work behind the scenes? It's more than just clicking "Buy" and getting a package. Let's dive into the exciting world of online retail, where every click, scroll, and purchase tells a fascinating story. The global eCommerce industry, valued at an astonishing $4.9 trillion, is like a dynamic digital kingdom that's constantly evolving.
Click here for detailed Dashboard_picture
In data analytics, the dataset with 541,909 entries and eight metrics is super important. It's like the main ingredient in our analytical recipe, helping us find trends and useful info. This data is a game-changer—it lets us make smart decisions, spot patterns, and come up with new ideas. With this data, we can achieve a lot, like improving strategies, making better choices, and staying ahead in the game. It's not just numbers; it's the secret sauce that makes our analytics work and helps us do awesome things.
Explore the raw data here
Click here for detailed exploratory analysis
Our journey into eCommerce analytics begins with questions that spark curiosity. How do big eCommerce giants like Amazon reach you with the products you love? Did you know that in the US, 41% of customers receive 1-2 packages from Amazon every week? Imagine the scale—millions of packages zipping across the country, each one telling a well-orchestrated eCommerce story.
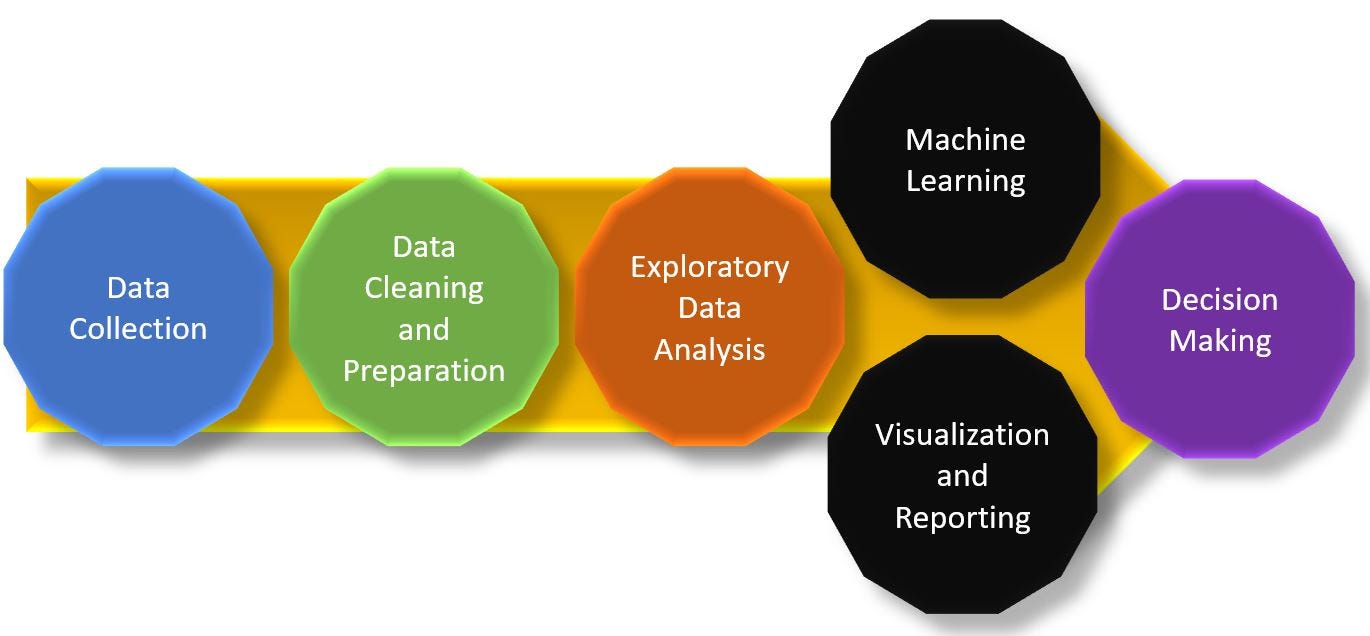
Data Cleaning, Exploratory Data Analysis (EDA), and Visualization are the pillars that support the entire analytics journey:
- Data Cleaning: Ensures the dataset is accurate, complete, and ready for analysis.
- EDA: Unveils patterns, outliers, and trends, turning raw data into actionable insights.
- Visualization: Transforms complex data into visual stories, aiding in understanding and decision-making.
These interconnected branches create a seamless flow from cleaning raw data to extracting meaningful insights, forming the foundation of our analytics voyage.
|
Quarter-on-Quarter Momentum: Every change in sales isn't just a number; it's a story—a tale told by seasons, marketing wins, and smart operations. Decoding these stories helps predict and respond strategically, shaping the destiny of online retail. |
↑ Uncover the Quarter-on-Quarter Momentum |
|
Strategic Customer Focus: Imagine the top 10% of customers receiving 1-2 packages weekly. It's not just about products; it's about crafting an experience. Fast deliveries for these VIPs solidify loyalty, ensuring they stay with you amidst the digital noise. It's a dance of data, ensuring you not only keep customers but create loyal advocates. |
↑ Explore the World of Top 10 Customers |
|
European Influence on Revenue: As we journey through eCommerce insights, we uncover surprising heroes—European countries shaping the revenue landscape beneath the American brand umbrella. It's not just about regions; it's about understanding cultural nuances, market dynamics, and regional preferences to cater to an unexpectedly lucrative audience. |
↑ Discover the European Influence on Revenue |
This isn't just about analytics; it's about using insights to shape the very landscape of online retail. The impact ripples through increased sales, stronger customer loyalty, and strategic market expansion. With data-driven precision, we've not just navigated the eCommerce currents; we've set sail toward unprecedented heights. This is the power of insights, and we're just getting started.
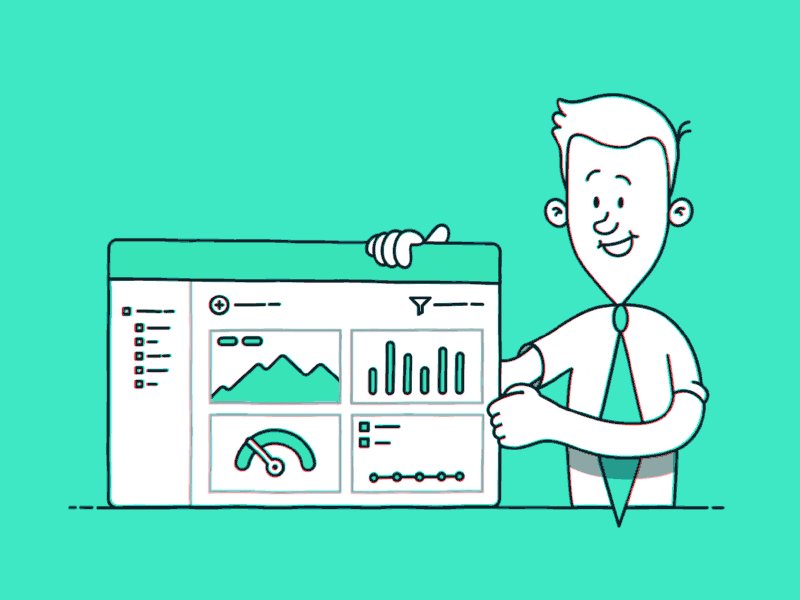
Now, let's step into the command center—the dashboard. It's not just a fancy visualization; it's where data becomes your ally, revealing patterns that guide your strategies. Imagine a dashboard that encapsulates the heartbeat of eCommerce—the insights, the VIP customers, the global influences. It's more than a tool; it's your compass in the digital wilderness.
Curious to explore the digital kingdom? Click the button below to embark on a hands-on journey. Brace yourself for a visual spectacle that unravels the secrets of our global retail store's performance. It's not just a dashboard; it's an invitation to witness the magic of eCommerce analytics.
This link takes you to the dashboard have a hands on use 🌐
For an extensive understanding of sales data and its impact:
Pipedrive: Sales Data BlogExplore real-world examples of brands using big data analytics:
Bornfight: Big Data Analytics Examples