A project utilizing the WebSocket capabilities of Kdb by the browser for getting the Kdb data in JSON format and displaying the relationship/network using the d3.js.
D3.js (D3 or Data-Driven Documents) is a javascript library for producing dynamic and interactive data visualizations using the full capabilities of modern powerful browsers. It is used widely on websites across the world for displaying the data in interactive graphical components.
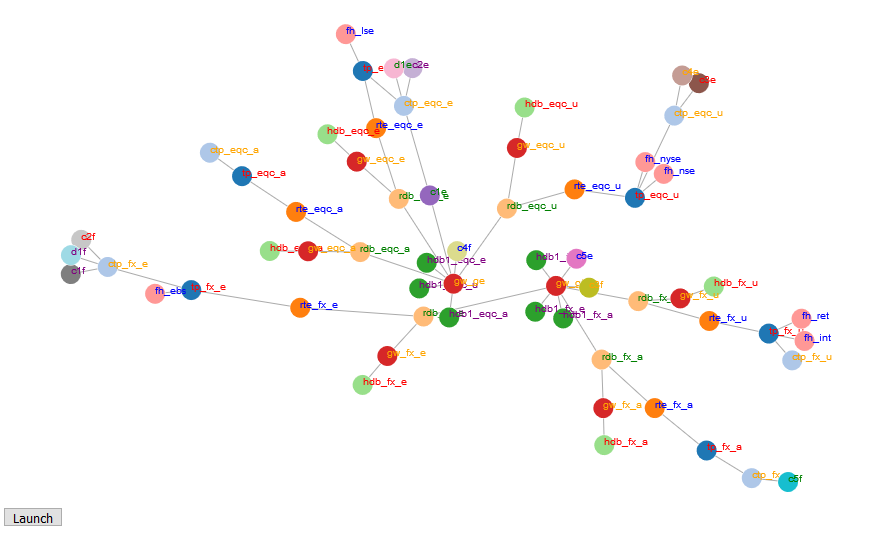
- Color coding of nodes based on groups
- Drag and stick the nodes on the canvas
- Double-click to release the sticky nodes
- Auto adjusting network contained within the canvas area
- Color coding of links
- Sizing of nodes based on the weights
- Dynamically update the network
- Add icon support to the nodes
- Add persistent and broken links feature