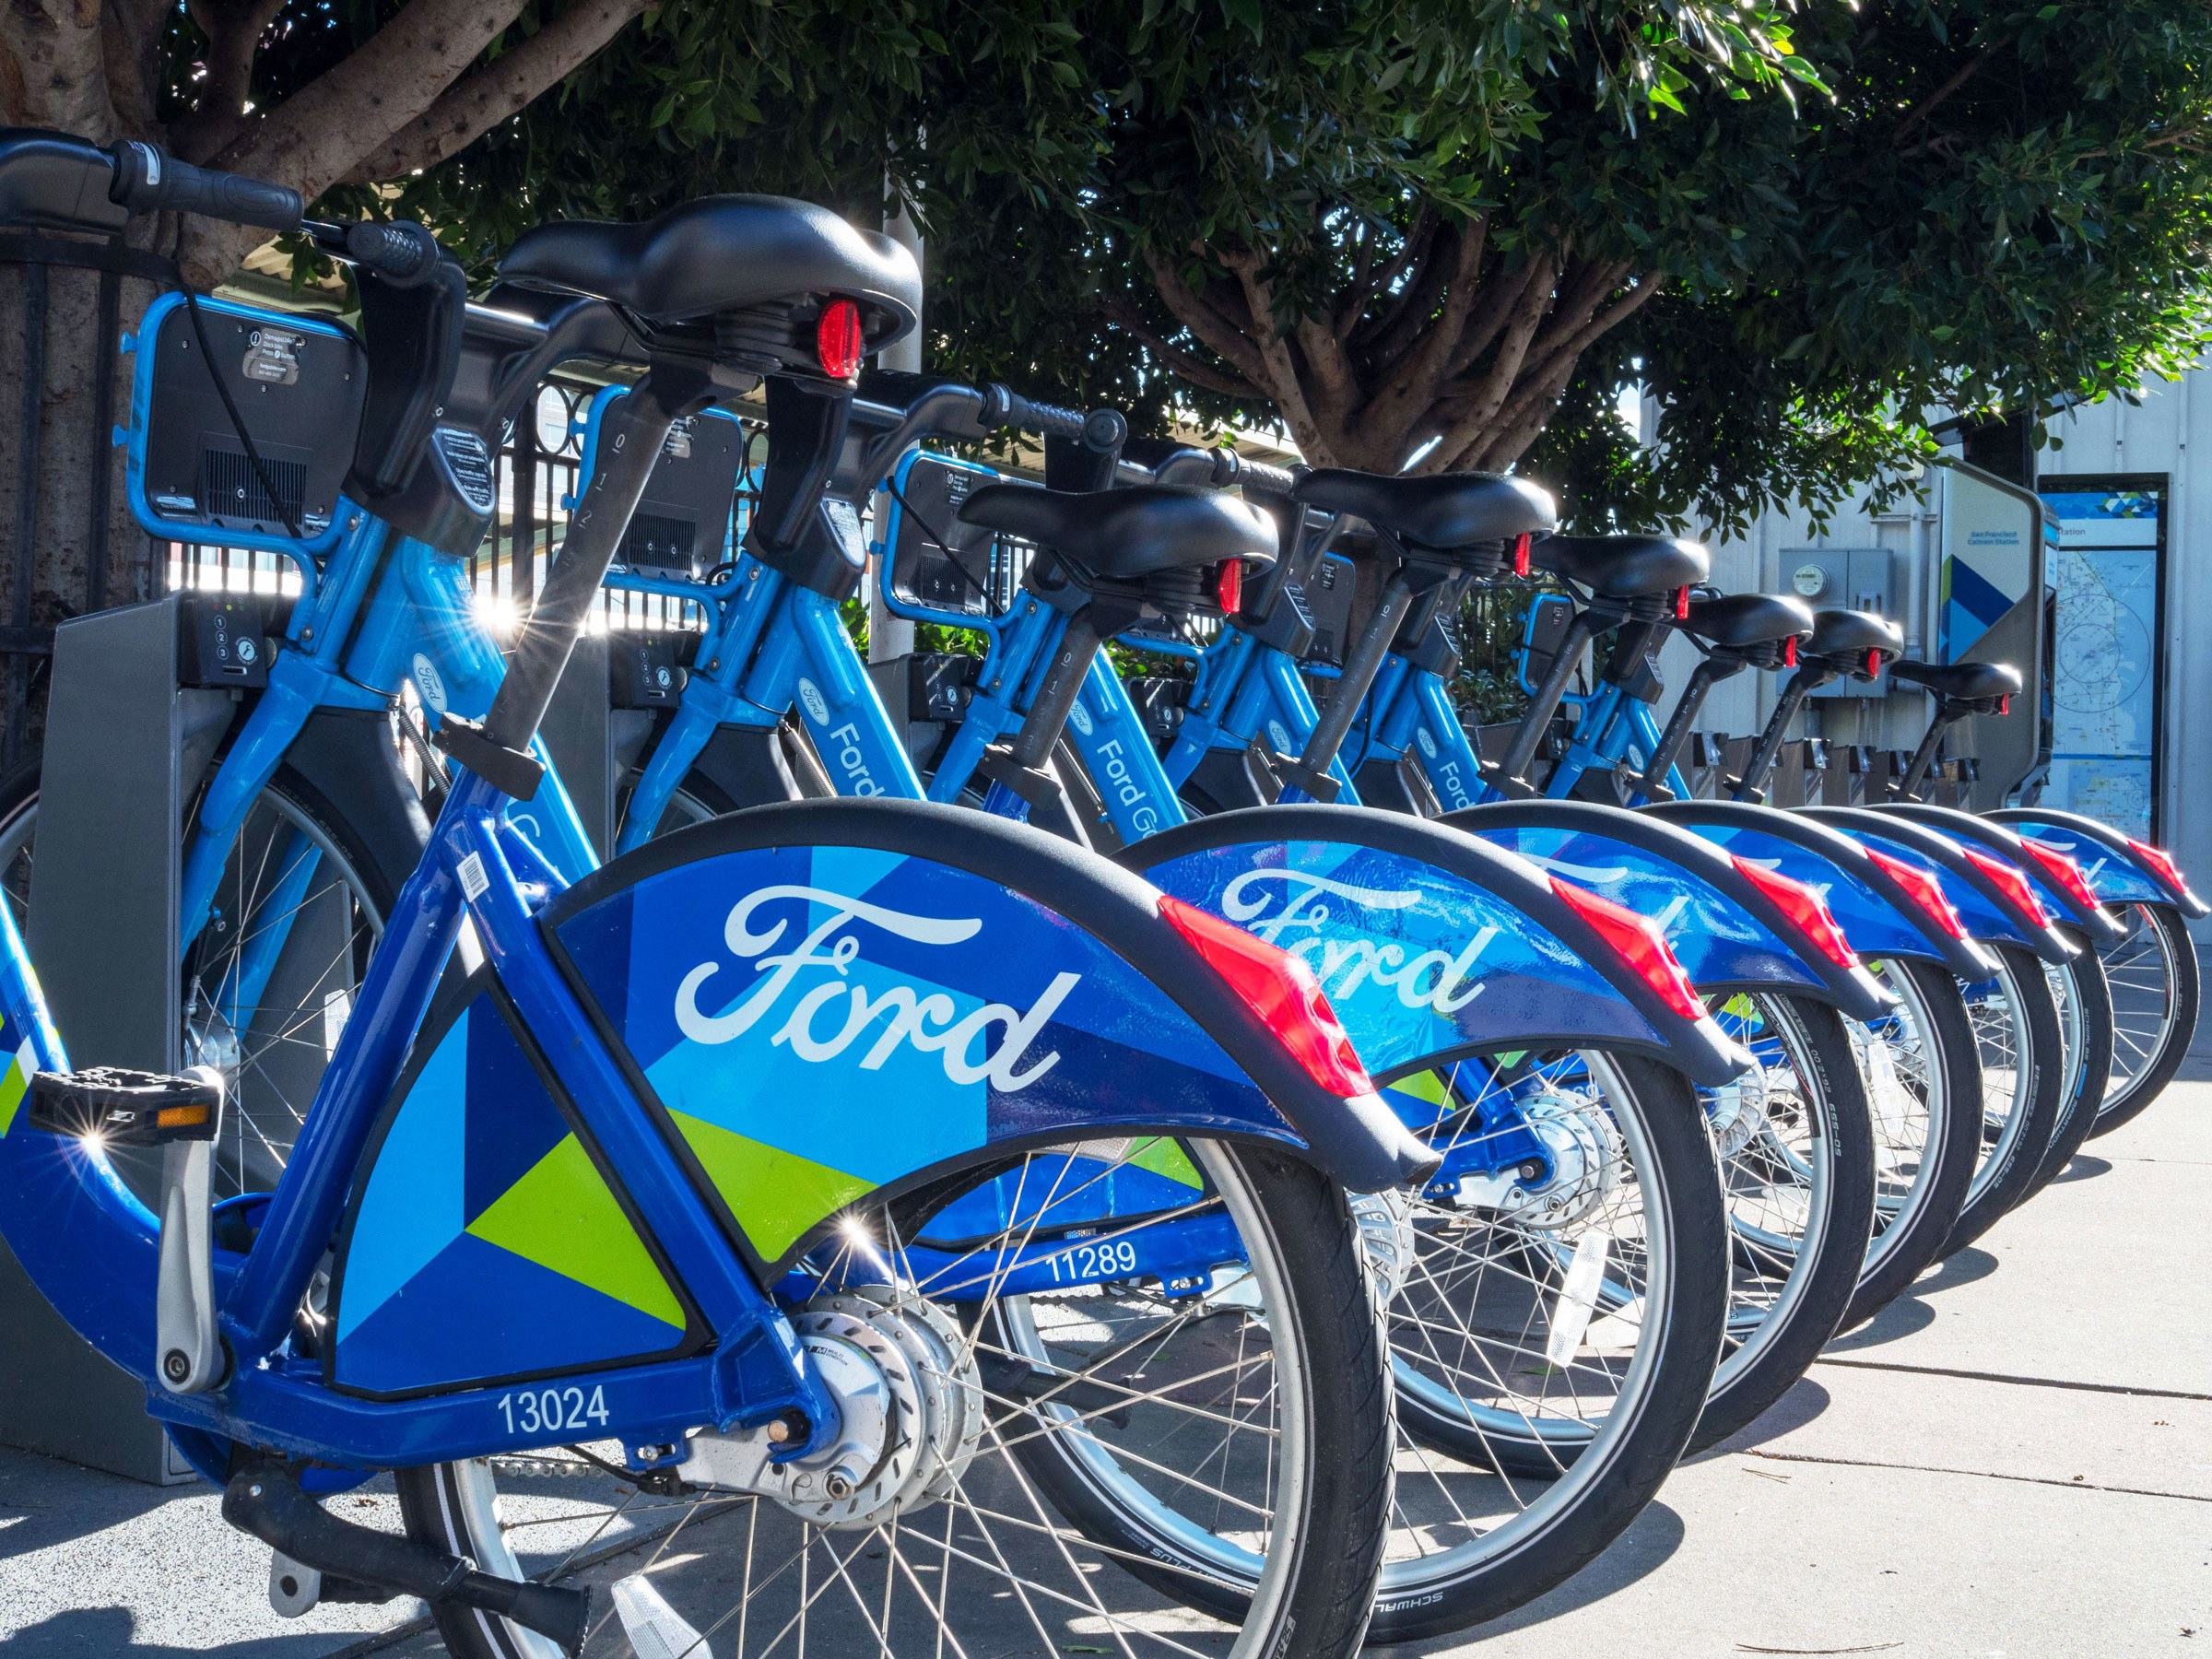
FordGo bike now Bay Wheels is a regional public bicycle sharing system in the San Francisco Bay Area, California operated by Motivate (a company based in New York City that operates bicycle sharing systems in the United States), in a partnership with the Metropolitan Transportation Commission and the Bay Area Air Quality Management District. Beginning operation in August 2013 as Bay Area Bike Share, the Bay Wheels system currently has over 2,600 bicycles in 262 stations across San Francisco, East Bay and San Jose. On June 28, 2017, the system officially re-launched as Ford GoBike in a partnership with Ford Motor Company. After Motivate's acquisition by Lyft, the system was subsequently renamed to Bay Wheels in June 2019. The system is expected to expand to 7,000 bicycles around 540 stations in San Francisco, Oakland, Berkeley, Emeryville, and San Jose. Bay Wheels is the first regional and large-scale bicycle sharing system deployed in California and on the West Coast of the United States.
As of January 2018, the system had seen nearly 500,000 rides since the launch in 2017 and had about 10,000 annual subscribers.
  1. numpy
  2. pandas
  3. matplotlib
  4. seaborn
  5. math
  6. requests
  7. zipfile
Data visualization is an important skill that is used in many parts of the data analysis process. Exploratory data visualization generally occurs during and after the data wrangling process, and is the main method that is used to understand the patterns and relationships present in your data. This understanding will help me approach any statistical analyses and will help me build conclusions and findings. This process might also illuminate additional data cleaning tasks to be performed. Explanatory data visualization techniques are used after generating my findings, and are used to help communicate my results to others. Understanding design considerations will make sure that my message is clear and effective. In addition to being a good producer of visualizations, going through this project will also help you be a good consumer of visualizations that are presented to you by others.
Previously there were 2,734,625 bike rides but after cleaning the data it is 2,583,000 rides happended during Jan 2018 to April 2019. The structure of the datatset:
trip duration : total ride duration in seconds
start time and end time : detailed timestamp
station id : unique station id
start station and end station name : characters
latitude and longitude for start station and end station : coordinates
customer user type : customer or subscriber
customer gender
customer birth date
bike id : unique bike id Additional columns were added in order to gain in-depth insight of the dataset:
member age
additional month, day , date , hour column were created
ride distance : in km
Interest is getting the insight out and understanding the user behavior with relationship to their attributes like:
Distribution of riders on a monthly and daily basis
Average ride duration
Average ride distance
Age groups of users
Gender distribution
A detailed conclusion has been provided in the Communicate_fordgo.ipynb and a brief report has been compiled in Slide_deck_fordgo.ipynb.
1. FordGoBike Data Set
2. Haversine formula used to calculate distances using latitude and longitude
3. Stackoverflow