一站式超大规模图计算系统
GraphScope 是阿里巴巴达摩院智能计算实验室研发并开源的一站式图计算平台。依托于阿里海量数据和丰富场景,与达摩院的高水平研究,GraphScope 致力于针对实际生产场景中图计算的挑战,提供一站式高效的解决方案。
GraphScope 提供了 Python 客户端,能十分方便的对接上下游工作流,具有一站式、开发便捷、性能极致等特点。它整合了智能计算实验室多个重要的创新性技术,包括 GRAPE,MaxGraph,Graph-Learn,支持了图分析、图的交互式查询和图学习。其中核心优势包括在业界首次支持了 Gremlin 分布式编译优化,支持了算法的自动并行化、提供了企业级场景下的极致性能等。在阿里巴巴内外部应用中,GraphScope 已经证明在多个关键互联网领域(如风控,电商推荐,广告,网络安全,知识图谱等)实现了重要的业务新价值。
GraphScope 整合了达摩院的多项学术研究成果,其中的核心技术曾获得数据库领域顶级学术会议 SIGMOD2017 最佳论文奖、VLDB2017 最佳演示奖、VLDB2020 最佳论文奖亚军、世界人工智能创新大赛SAIL奖等。GraphScope 的交互查询引擎的论文已被 NSDI 2021录用。还有其它围绕 GraphScope 的十多项研究成果发表在领域顶级的学术会议或期刊上,如 TODS、SIGMOD、VLDB、KDD等。
欢迎访问我们的网站 graphscope.io 了解更多信息。
我们提供了一个基于 JupyterLab 的 Playground,您可以从浏览器中在线试用 GraphScope。
GraphScope 设计在 Kubernetes (k8s) 管理的群集上运行。为了快速上手,我们可以按照本文档的以下步骤部署一个本地 Kubernetes 集群,并加载预编译好的镜像。。
本地运行 GraphScope 需要预先安装以下依赖:
- Docker
- Python >= 3.6 (以及 pip)
- Local Kubernetes cluster set-up tool (例如 Kind)
对于 Windows 和 MacOS 的用户,可通过官方文档来安装上述依赖, 并在Docker中开启Kubernetes功能。
对于 Ubuntu/CentOS Linux 发行版用户,我们提供了脚本来准备运行时环境。
您也可以在 Windows 上安装 WSL2 <https://docs.microsoft.com/zh-cn/windows/wsl/install-win10>_ 以使用脚本。
# run the environment preparing script.
./scripts/prepare_env.shGraphScope 的 Python 客户端以包的形式分发,您可以通过 pip命令十分方便的安装。
pip3 install graphscope接下来我们会用一个具体的例子,来演示 GraphScope 如何帮助数据科学家高效的分析、处理大规模图数据。
当前发布的版本没有包含一些例如鉴权、加密之列的安全功能,暂时不推荐在生产环境使用。我们后续会有一些安全性更新,请您持续关注。
ogbn-mag 是由微软学术关系图(Microsoft Academic Graph)的子集组成的异构图网络。该图中包含4种类型的实体(即论文、作者、机构和研究领域),以及连接两个实体的四种类型的有向关系边。
我们需要处理的任务是,给出异构的 ogbn-mag 数据,在该图上预测每篇论文的类别。这是一个节点分类任务,该任务可以归类在各个领域、各个方向或研究小组的论文,通过对论文属性和引用图上的结构信息对论文进行分类。在该数据中,每个论文节点包含了一个从论文标题、摘要抽取的 128 维 word2vec 向量作为表征,该表征是经过预训练提前获取的;而结构信息是在以下过程中即时计算的。
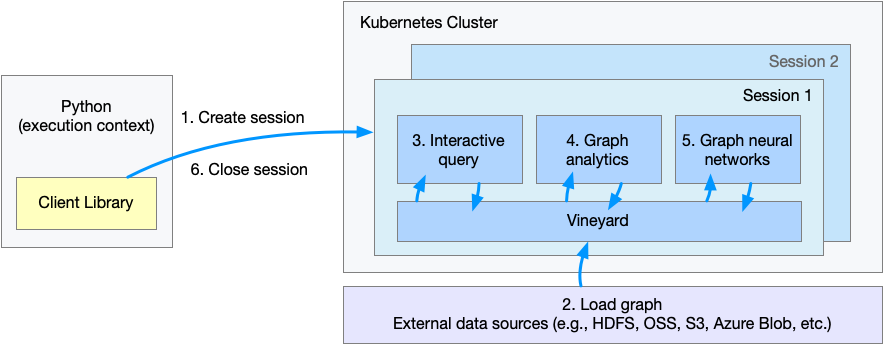
上图表示了用户通过 Python 客户端调用 GraphScope 解决该问题的工作流程。
- 步骤 1. 建立一个会话(session),为 GraphScope 创建一个工作空间;
- 步骤 2. 定义和载入图;
- 步骤 3. 通过 gremlin 交互式查询图;
- 步骤 4. 执行图算法做图分析;
- 步骤 5. 执行基于图数据的机器学习任务;
- 步骤 6. 关闭会话。
使用 GraphScope 的第一步,我们需要在 Python 中创建一个会话(session)。
import os
import graphscope

# Setting an env for mounting test data from local disk,
# hence we can access data inside the pods.

# assume we mount `~/test_data` to `/testingdata` in pods.
k8s_volumes = {
    "data": {
        "type": "hostPath",
        "field": {
          "path": os.path.expanduser("~/test_data/"),
          "type": "Directory"
        },
        "mounts": {
          "mountPath": "/testingdata"
        }
    }
}

sess = graphscope.session(k8s_volumes=k8s_volumes)
对于 macOS,创建会话需要使用 LoadBalancer 服务类型(默认是 NodePort)。
sess = graphscope.session(k8s_volumes=k8s_volumes, k8s_service_type="LoadBalancer")会话的建立过程中,首选会在背后尝试拉起一个 coordinator 作为后端引擎的入口。
该 coordinator 负责管理该次会话的所有资源(k8s pods),以及交互式查询、图分析、图学习引擎的生命周期。
在 coordinator 后续拉起的其他每个 pod 中,都有一个 vineyard 实例作为内存管理层,分布式的管理图数据。
GraphScope 以属性图(property graph)建模图数据。属性图中,点和边都有一个标签(label),不同的标签有不同的属性(property)。
以 ogbn-mag 为例,下图展示了属性图的模型。
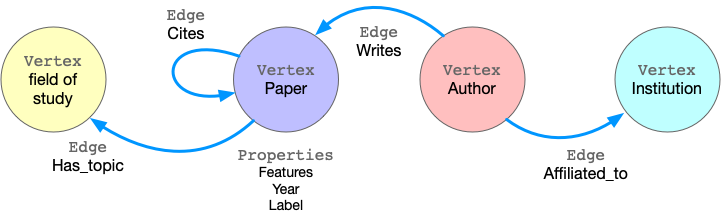
该图具有四种顶点,分别标记为“论文”、“作者”、“机构”和“研究领域”。有四种连接它们的边, 每种边都有一个标签,并且边的两端顶点的标签也是确定的。 例如,“引用”这种标签的边连接两个“论文”顶点。另一个例子是标记为“撰写”的边, 它要求该起始点的标记为“作者”,终止点的标记为“论文”。 所有的顶点和边都可以具有属性。 例如,“论文”顶点具有诸如发布年份、主题标签等属性。
要将此图加载到 GraphScope,可以将以下代码与
数据文件结合使用。
请下载数据并将其解压缩到本地的挂载目录(在本例中为〜/test_data)。
g = sess.g()
g = (
    g.add_vertices("/testingdata/ogbn_mag_small/paper.csv", label="paper")
    .add_vertices("/testingdata/ogbn_mag_small/author.csv", label="author")
    .add_vertices("/testingdata/ogbn_mag_small/institution.csv", label="institution")
    .add_vertices("/testingdata/ogbn_mag_small/field_of_study.csv", label="field_of_study")
    .add_edges(
        "/testingdata/ogbn_mag_small/author_affiliated_with_institution.csv",
        label="affiliated", src_label="author", dst_label="institution",
    )
    .add_edges(
        "/testingdata/ogbn_mag_small/paper_has_topic_field_of_study.csv",
        label="hasTopic", src_label="paper", dst_label="field_of_study",
    )
    .add_edges(
        "/testingdata/ogbn_mag_small/paper_cites_paper.csv",
        label="cites", src_label="paper", dst_label="paper",
    )
    .add_edges(
        "/testingdata/ogbn_mag_small/author_writes_paper.csv",
        label="writes", src_label="author", dst_label="paper",
    )
)
同时,我们也提供了一个函数,以方便的载入该图。
from graphscope.dataset.ogbn_mag import load_ogbn_mag

g = load_ogbn_mag(sess, "/testingdata/ogbn_mag_small/")
请注意,这里的 g 已经是一个分布式存储在 vineyard 中的图。图数据分布在这个会话背后拉起的 k8s pods中。
交互式查询允许用户以“探索性”方式来探索、查看和显示图数据,以方便的定位和洞察特定的深入信息。GraphScope 采用称为 Gremlin 的高级语言进行图遍历,并提供大规模的高效执行。
在此示例中,我们使用图遍历来查看两位给定作者共同撰写的论文数量。为了简化查询,我们假设作者可以分别由ID 2 和 4307 唯一标识。
# get the endpoint for submitting Gremlin queries on graph g.
interactive = sess.gremlin(g)

# count the number of papers two authors (with id 2 and 4307) have co-authored
papers = interactive.execute("g.V().has('author', 'id', 2).out('writes').where(__.in('writes').has('id', 4307)).count()").one()图分析是在真实场景中被广泛使用的一类图计算。事实证明,许多算法(例如社区检测,路径和连接性,集中性)在各种业务中都非常有效。GraphScope 内建了一组预置常用算法,方便用户可以轻松分析图数据。
继续我们的示例,下面我们首先通过在特定周期内从全图中提取论文(使用Gremlin!)来导出一个子图,然后运行 k-core 分解和三角形计数以生成每个论文节点的结构特征。
请注意,许多算法可能仅适用于同构图(只有一类点和一类边而不区分标签),因此,要在属性图上使用这些算法,我们首先需要将其投影到一个简单的同构图中。
# extract a subgraph of publication within a time range
sub_graph = interactive.subgraph("g.V().has('year', inside(2014, 2020)).outE('cites')")

# project the projected graph to simple graph.
simple_g = sub_graph.project(vertices={"paper": []}, edges={"cites": []})

ret1 = graphscope.k_core(simple_g, k=5)
ret2 = graphscope.triangles(simple_g)

# add the results as new columns to the citation graph
sub_graph = sub_graph.add_column(ret1, {"kcore": "r"})
sub_graph = sub_graph.add_column(ret2, {"tc": "r"})
此外,用户还可以在 GraphScope 中编写自己的算法。当前,GraphScope 支持用户以 Pregel 模型和 PIE 模型自定义图算法。
图神经网络(GNN)结合了图结构和机器学习的优势,可以将图中的结构信息和属性信息压缩为每个节点上的低维嵌入向量。这些嵌入和表征可以进一步输入到下游的机器学习任务中。
在我们的示例中,我们训练了 GCN 模型,将节点(论文)分类为349个类别,每个类别代表一个出处(例如预印本和会议)。为此,首先我们接着上一步,启动学习引擎并构建一个具有特征的数据图。
# define the features for learning
paper_features = []
for i in range(128):
    paper_features.append("feat_" + str(i))

paper_features.append("kcore")
paper_features.append("tc")

# launch a learning engine.
lg = sess.learning(sub_graph, nodes=[("paper", paper_features)],
                  edges=[("paper", "cites", "paper")],
                  gen_labels=[
                      ("train", "paper", 100, (0, 75)),
                      ("val", "paper", 100, (75, 85)),
                      ("test", "paper", 100, (85, 100))
                  ])
然后我们定义一个训练过程并执行。
# Note: Here we use tensorflow as NN backend to train GNN model. so please
# install tensorflow.
from graphscope.learning.examples import GCN
from graphscope.learning.graphlearn.python.model.tf.trainer import LocalTFTrainer
from graphscope.learning.graphlearn.python.model.tf.optimizer import get_tf_optimizer

# supervised GCN.

def train(config, graph):
    def model_fn():
        return GCN(
            graph,
            config["class_num"],
            config["features_num"],
            config["batch_size"],
            val_batch_size=config["val_batch_size"],
            test_batch_size=config["test_batch_size"],
            categorical_attrs_desc=config["categorical_attrs_desc"],
            hidden_dim=config["hidden_dim"],
            in_drop_rate=config["in_drop_rate"],
            neighs_num=config["neighs_num"],
            hops_num=config["hops_num"],
            node_type=config["node_type"],
            edge_type=config["edge_type"],
            full_graph_mode=config["full_graph_mode"],
        )
    trainer = LocalTFTrainer(
        model_fn,
        epoch=config["epoch"],
        optimizer=get_tf_optimizer(
            config["learning_algo"], config["learning_rate"], config["weight_decay"]
        ),
    )
    trainer.train_and_evaluate()


config = {
    "class_num": 349,  # output dimension
    "features_num": 130,  # 128 dimension + kcore + triangle count
    "batch_size": 500,
    "val_batch_size": 100,
    "test_batch_size": 100,
    "categorical_attrs_desc": "",
    "hidden_dim": 256,
    "in_drop_rate": 0.5,
    "hops_num": 2,
    "neighs_num": [5, 10],
    "full_graph_mode": False,
    "agg_type": "gcn",  # mean, sum
    "learning_algo": "adam",
    "learning_rate": 0.0005,
    "weight_decay": 0.000005,
    "epoch": 20,
    "node_type": "paper",
    "edge_type": "cites",
}

train(config, lg)
可以点击 node_classification_on_citation.ipynb 查看完整的代码以及执行结果。 (当前图学习的功能还无法支持 macOS)
最后,当我们完成所有的计算过程后,关闭当前的会话。该步骤会告知背后的 Coordinator 和引擎,释放当前所有的资源。
sess.close()GraphScope 包含一个 Dockerfile,可以构建 Docker 映像。 这些映像会在单独的构建镜像上构建,完成后再复制生成的二进制文件到运行时基础镜像,进行分发。构建镜像和运行时基础镜像都预装了所有所需的第三方依赖和环境。要构建最新的 GraphScope 镜像,在根目录运行此命令。
# for the first time, run this script to install make, doxygen for docs and java env for testing.
# ./scripts/prepare_dev.sh

make graphscope
make interactive_manager
# by default, the built image is tagged as graphscope/graphscope:SHORTSHA and graphscope/maxgraph_standalone_manager:SHORTSHAGraphScope Python 包与 GraphScope docker 镜像是独立构建的。 如果您正在开发 Python 客户端且未修改 protobuf 文件,则 GraphScope docker 镜像不需要重新构建。您只需要在本地重新安装 Python 客户端。
cd python
python3 setup.py install
请注意,图学习引擎的客户端具有 C/C++ 扩展模块,并需要额外的构建环境。 默认情况下,本地构建的客户端库不包含对图学习引擎的支持。如果需要构建包含图学习引擎的 Python 包,请参阅 构建 Python Wheels.
为了验证您所开发功能的正确性,您所做的代码更改应通过我们的测试。通过以下脚本执行测试流程。
# for the first time, run this script to install make, doxygen for docs and java env for testing.
# ./scripts/prepare_dev.sh

# run all test cases
./scripts/test.sh --all

# run all test cases on your built image
./scripts/test.sh --all --gs_image graphscope/graphscope:SHORTSHA --gie_manager_image graphscope/maxgraph_standalone_manager:SHORTSHA

# or run the selected cases on a certain module. e.g.,
./scripts/test.sh --python
./scripts/test.sh --gieGraphScope 的文档构建依赖 Sphinx。您可以自己通过以下命令构建一份完整的文档。
# build the docs
make graphscope-docs

# to open preview on local
open docs/_build/html/index.html
或者最新版的文档也可以查阅这里 https://graphscope.io/docs
GraphScope 遵循 Apache License 2.0 开源许可协议。请注意,代码库中的一些第三方库可能有不同的开源许可协议。
我们热忱欢迎和感谢来自社区的各种贡献!
- 在 Slack channel 参与讨论;
- 通过 GitHub issue 报告 bug 或者提出功能需求;
- 通过 Pull requests 提交代码修改。