Skip to content
New issue

Have a question about this project? Sign up for a free GitHub account to open an issue and contact its maintainers and the community.

By clicking “Sign up for GitHub”, you agree to our terms of service and privacy statement. We’ll occasionally send you account related emails.

Already on GitHub? Sign in to your account

这么好的工具没有继续再开发了么 #38

Open
solio opened this issue Jun 8, 2016 · 3 comments
Open

这么好的工具没有继续再开发了么 #38

solio opened this issue Jun 8, 2016 · 3 comments

Comments

@solio
Copy link

solio commented Jun 8, 2016

大阿里的程序员diaodiao的

@snaigle
Copy link

snaigle commented Jun 16, 2016

应该只是他们开发者没精力维护这个开源版本了,阿里内部也需要这样一个工具

@mccxj
Copy link

mccxj commented Dec 12, 2017

我打算重新整一个来搞。

@LinShunKang
Copy link

LinShunKang commented Jun 10, 2018

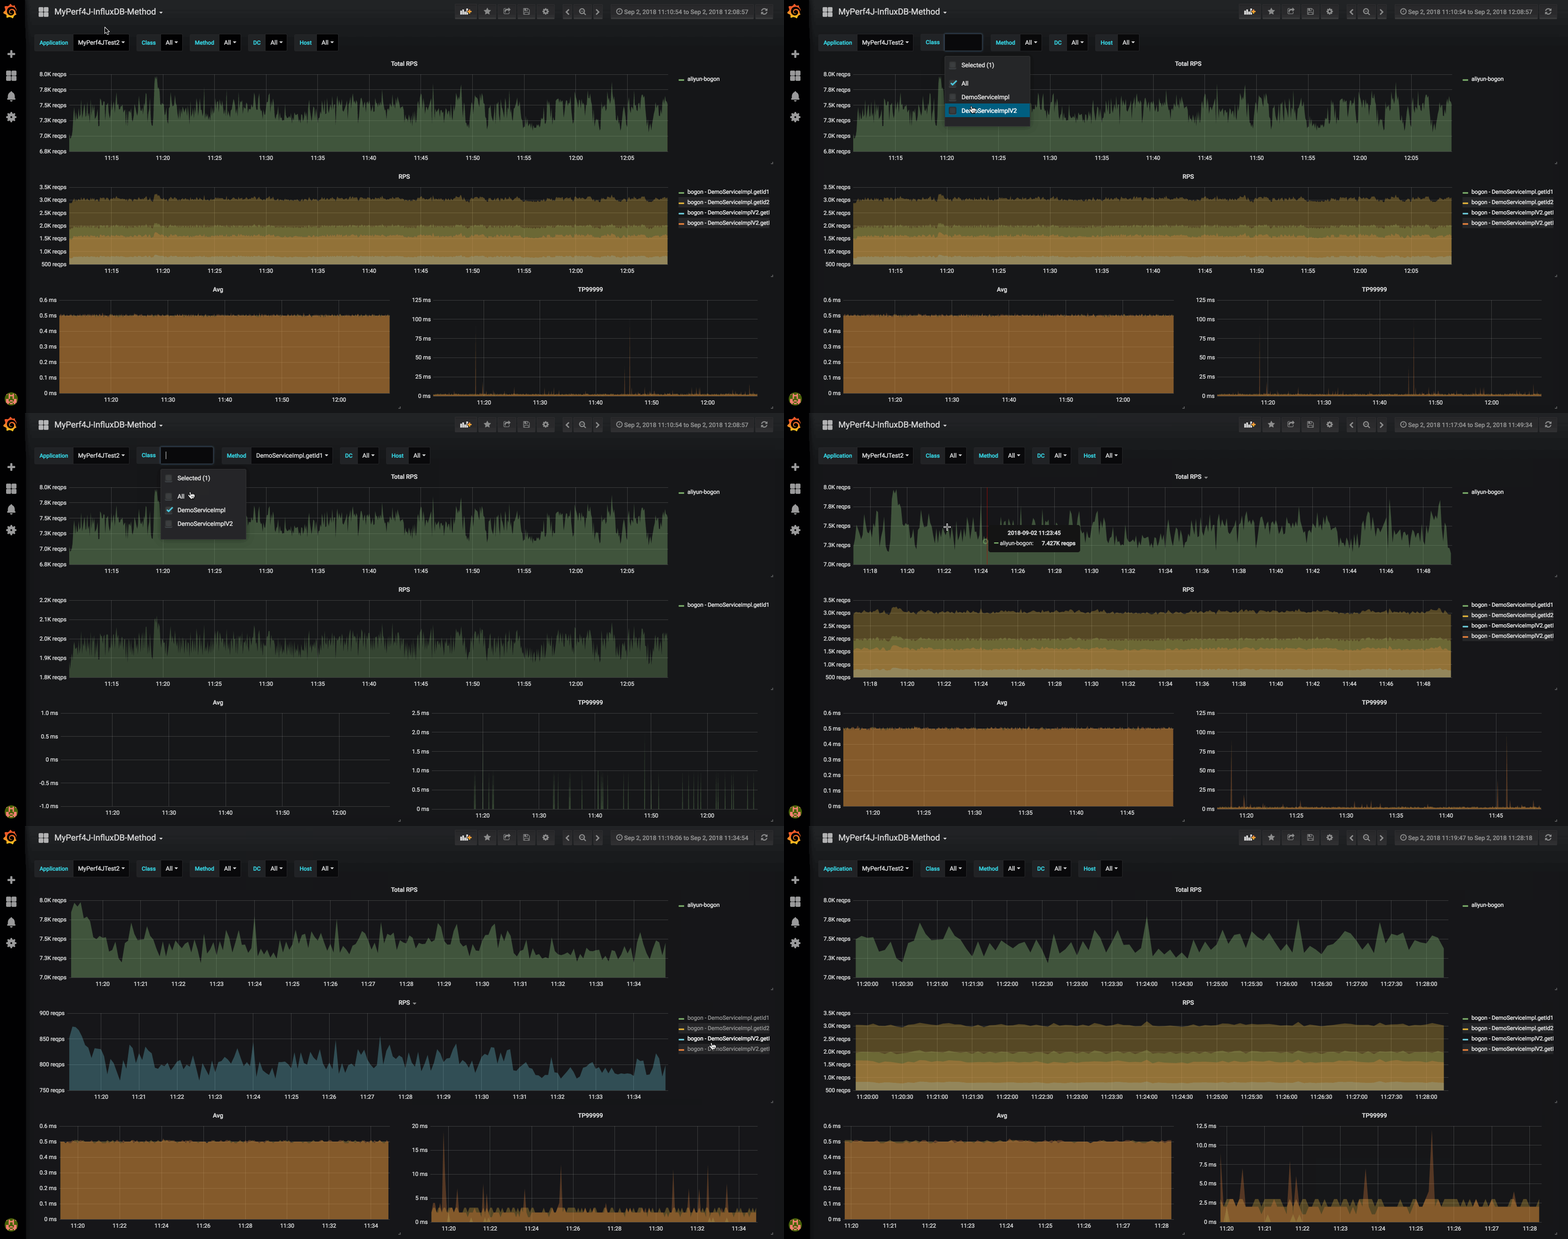
我借鉴Perf4J和TProfiler,开发了MyPerf4J.

MyPerf4J为每个应用收集数十个监控指标,所有的监控指标都是实时采集和展现的。

下面是MyPerf4J目前支持的监控指标列表:

  • Method Metrics: RPS, Count, Avg, Min, Max, StdDev, TP50, TP90, TP95, TP99, TP999, TP9999, TP99999, TP100
  • JVM Thread Metrics: TotalStarted, Runnable, Blocked, Waiting, TimedWaiting, Terminated, Active, Peak, Daemon, New
  • JVM Memory Metrics: HeapInit, HeapUsed, HeapCommitted, HeapMax, NonHeapInit, NonHeapUsed, NonHeapCommitted, NonHeapMax
  • JVM GC Metrics: CollectCount, CollectTime
  • JVM Class Metrics: Total Loaded, Unloaded

MyPerf4J具有以下几个特性:

  • 无侵入: 采用JavaAgent方式,对应用程序完全无侵入,无需修改应用代码
  • 高性能: 性能消耗非常小,每次记录只花费73ns,可以在生产环境长期使用
  • 低内存: 采用内存复用的方式,整个生命周期只产生极少的临时对象,不影响应用程序的GC
  • 高精度: 采用纳秒来计算响应时间
  • 高实时: 支持秒级监控,最低1s!

Markdown

Sign up for free to join this conversation on GitHub. Already have an account? Sign in to comment
Labels
None yet
Projects
None yet
Development

No branches or pull requests

4 participants