toplev manual
When improving the performance of a program it is important to know what the bottleneck is. Programs can be bound on IO (the disk or the network), or they can be bound on the CPU or on other components, such as the GPU.
Most CPUs have a PMU (Performance Monitoring Unit). In fact they have multiple ones, see ucevent for a tool to monitor other PMUs. This methodology is using the PMU in each core on modern Intel CPUs to measure core bottlenecks.
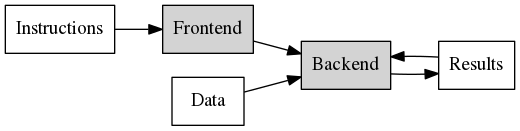
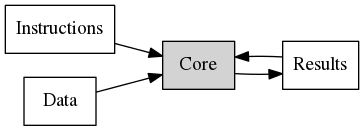
On a high level we can think of a modern CPU core as a black box where instructions and data come in, and results come out.

This requires moving data around. The goal of TopDown is to identify the bottleneck that limits this computation. TopDown is organized in different levels, each becoming more detailed. Let us look at Level 1:

These are the top level (Level 1) nodes, each representing a bottleneck. TopDown computes the percent each bottleneck limits the performance of the computation
Frontend Bound means the part of the core that fetches instructions is the bottleneck. Instructions either could not not be read fast enough, or it took too long to decode them.
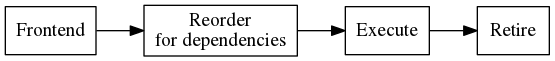
Bad Speculation needs a bit more context. A CPU core consists of a pipeline
that splits work into small stages, each working in a different clock cycle.
In practice most results coming out of the CPU are immediately reused for more computation. This means that
results are actually fed back into the computation black box.
This implies that the next instructions would need to wait until the previous instructions have finished, so that the result can be used.
When we consider branches that are dependent on previously computed data it becomes worse.
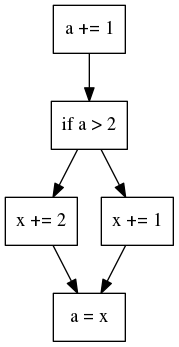
The core would need to finish the first and the second block before it can execute any further, causing stalls in the pipeline if there are any delays. To avoid this problem modern CPUs use branch prediction and out of order execution to execute instructions speculatively ahead.
This speculation can go wrong and work may need to be discarded, for example if the branch was mispredicted. TopDown captures that in the Bad Speculation node.
Backend Bound means the actual computation is the bottleneck. Most computations (such as adds) can be done in a single cycle, but others (such as division) can take much longer. In TopDown this also includes any delays due to memory accesses, fetching the data, which is a very common problem.
Retiring finally means that the computation was not limited on anything particular, but the CPU core was successfully retiring not otherwise bottle-necked instructions.
These were the level 1 nodes. In TopDown there are more levels that identify the bottlenecks for the different nodes in more detail. The nodes are organized in a tree. The level numbering starts with the top level nodes. A node in a lower level is only shown when the parent crosses a threshold. Here is the tree for a two level model for IvyBridge.

For more details please see the full hierarchy and the TopDown papers. The actual hierarchy can also vary by CPU type.
In addition to hierarchical nodes TopDown also supports metrics to measure additional information. These are not expressed in percent, but in other units. Often they are ratios. Supported metrics include standard metrics, like Instructions-per-Cycle (IPC), but also many more exotic measurements.
toplev is a tool, part of pmu-tools, that implements TopDown on top of Linux perf for modern Intel CPUs.
toplev identifies bottlenecks in executing CPU bound code. It makes no judgements on how efficient the algorithms in the workload are. It also cannot identify the real bottleneck in code that is not bound by CPU (see below)
In toplev the ```-lxxx''' option sets the maximum level to measure.
Metrics are not collected by default in toplev, but need to be explicitly enabled with the --metrics option.
toplev also supports power measurements (with --power), and software metrics (with --sw), such as context switches or interrupts.
toplev runs on Linux and requires the perf tool to be installed. toplev also requires access to the PMU, which needs to be enabled when running in a VM. It needs a recent enough Linux kernel (see kernel support) and the perf tool.
It supports Intel Core CPUs since Sandy Bridge (3rd generation Core) and derived Xeon CPUs. There is limited support for Atom based CPUs.
Toplev requires Internet access at least once to download the event lists for the current CPU (if you do not have Internet access please see here In corporate networks this may require setting up a https proxy.
pmu-tools is on a rolling release model, so there are no releases. Just check out the latest version:
# setup proxy as needed, e.g. export https_proxy=...

% git clone https://github.com/andikleen/pmu-tools
Toplev is not installed, but run from the source directory. You can add
it to the PATH to call it easily
% cd pmu-tools
% export PATH=$PATH:`pwd`
In many cases toplev needs to measure the whole system. In the default perf configuration this requires running as root. In this case you may need to run toplev with sudo or as a root user. An alternative is to configure perf to allow full access for non root:
% sudo sysctl -p 'kernel.perf_event_paranoid=-1'
or add the line to /etc/sysctl.conf. Note that this mode is not secure,
it allows everyone on the system to measure all code running on it.
toplev also requires disabling the NMI watchdog. Use
% sudo sysctl -p 'kernel.nmi_watchdog=0'
or also add the line to /etc/sysctl.conf
Then toplev can be executed directly in other directories.
The first run needs to connect to the Internet. Later runs as the same user
have the event list cached in ~/.cache/pmu-events and can operate offline.
Note that if you need to set up a proxy and use toplev with sudo you may need
to set the proxy up for the sudo user.
% sudo bash
# export https_proxy=...
# /path/to/toplev/toplev.py ...
This is only needed for the first run, or when the CPU changes.
toplev is a counting tool. It uses the CPU performance counters to count events. Counting is quite accurate, but it does not directly identify where in a program a particular problem is occurring. This can be only done with a sampling tool, that records program locations of hot code. Essentially toplev can tell you what happens, but it has only limited capabilities on where something happens, as it focused on counting. There is a limited experimental capability to use sampling to identify the location of identified workload bottlenecks.
One typical scenario is that you already know from sampling with a standard tool (such as perf record / report or perf top or another profiler like sysprof or pyprof) where your hot code is, but you want to understand why that code is slow.
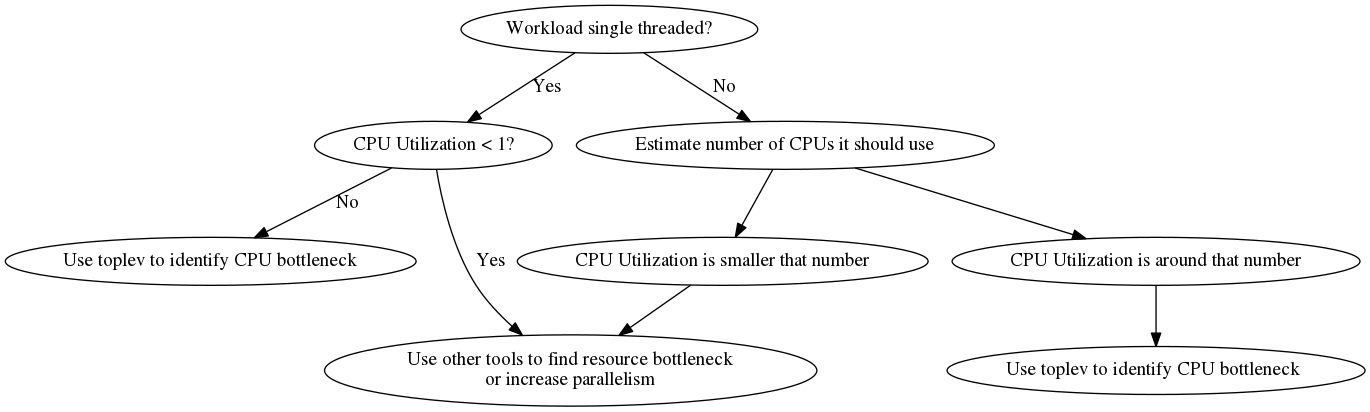
The first step is to identify if the program is really bound by the CPU. TopDown can only help for CPU bound problems. If the bottleneck is somewhere else other methologies must be used. Non CPU bottlenecks can be networking, blocking latencies (such as synchronization), disk IO, graphics cards and others.
See Brendan Gregg perf methods for a good overview of finding problems generically. For some areas, such as IO or synchronization latencies specialized tools like latencytop can be used.
TopDown is a methodology to identify CPU bottlenecks. It finds the bottleneck of whatever code is executing. It does not know if the code does unnecessary work. Often before tuning TopDown it is a good idea to use a sampling profiler to examine algorithmic issues. But when "low hanging fruit" in this area have been exhausted it can be good to focus on the CPU execution.
toplev typically measures the complete system. If you specify a workload it will measure the complete system while the workload runs.
% toplev.py my-workload
Alternatively you can use
% toplev.py sleep XXX
with XXX being the number of seconds to measure to measure for a given time.
toplev will then output the results on all CPUs. Let us measure a simple
workload. This is a bc expression tuned to run roughly 1s on my laptop
(in most cases it is probably better to use longer running workloads).
We run it at Level 1 to avoid any multiplexing.
% toplev.py -l1  bash -c 'echo "7^199999" | bc > /dev/null'
Will measure complete system.
Using level 1.
...
C0    BAD     Bad_Speculation:		 31.66%
	This category reflects slots wasted due to incorrect
	speculations, which include slots used to allocate uops that
	do not eventually get retired and slots for which allocation
	was blocked due to recovery from earlier incorrect
	speculation...
C1    FE      Frontend_Bound:		  42.46%
	This category reflects slots where the Frontend of the
	processor undersupplies its Backend...
C1    BE      Backend_Bound:		   27.25%
	This category reflects slots where no uops are being
	delivered due to a lack of required resources for accepting
	more uops in the Backend of the pipeline...
C0-T0 CPU utilization:			   0.00 CPUs
	Number of CPUs used...
C0-T1 CPU utilization:			   0.00 CPUs
C1-T0 CPU utilization:			   0.00 CPUs
C1-T1 CPU utilization:			   0.00 CPUs
toplev prints a description each time a node is first printed. By default
it shows a short description, long descriptions can be enabled with --long-desc.
In further examples we disable the descriptions to get shorter output.
Some values are collected by core and other by logical CPU thread.
In this case we did not bind the workload (bc) to a CPU, so it is not
clear if the C0 or C1 numbers are relevant. As bc is single-threaded we can
just bind it to a known cpu core and use --core to filter the output on that core:
% toplev.py --core C0 --no-desc -l1 taskset -c 0  bash -c 'echo "7^199999" | bc > /dev/null'
Will measure complete system.
Using level 1.
...
C0    BAD     Bad_Speculation:		 33.29%
C0-T0 CPU utilization:			   0.00 CPUs
C0-T1 CPU utilization:			   0.00 CPUs
The taskset technique also works with multiple threads by binding to more CPUs, and filtering by those.
So bc is limited by Bad Speculation. We could now select more nodes and analyze the problem in more details.
If the workload is known to be single-threaded and we can ensure an otherwise
idle system it is also possible to use the --single-thread option:
% toplev.py --no-desc --single-thread bash -c 'echo "7^199999" | bc > /dev/null'
..
BAD     Bad_Speculation:		 32.65%
CPU utilization:			   0.00 CPUs
perf will automatically follow the program on all CPUs. This option also does not require any root or perf_event_paranoid rights. It makes the data analysis easier, as there is only a single output for each node. However it is only valid for the single thread case with an idle system.
Programs often behave very differently in their initialization phase than they do later in their lifecycle. For accurate measurements it is often useful to skip that phase. This can be done with the -D xxx option, with xxx being the number of milliseconds to skip (requires recent perf). When the program runs long enough this is typically not needed, but it helps improve accuracy for shorter tests.
By default toplev measures both kernel and user code. If you are only interested in
the user code the --user option can be used. This tends to reduce measurements noise,
as interrupts are filtered out. There is also a --kernel option to only measure kernel
code.
On complex workloads with multiple phases it can also be useful to measure intervals.
This can be specified with the -I xxxi option, with xxx being the number of milliseconds
of the interval. perf requires a minimum of 100ms in the interval.
Toplev will output a measurement for each interval. This tends to generate a lot of data,
so it can be then useful to plot the output.
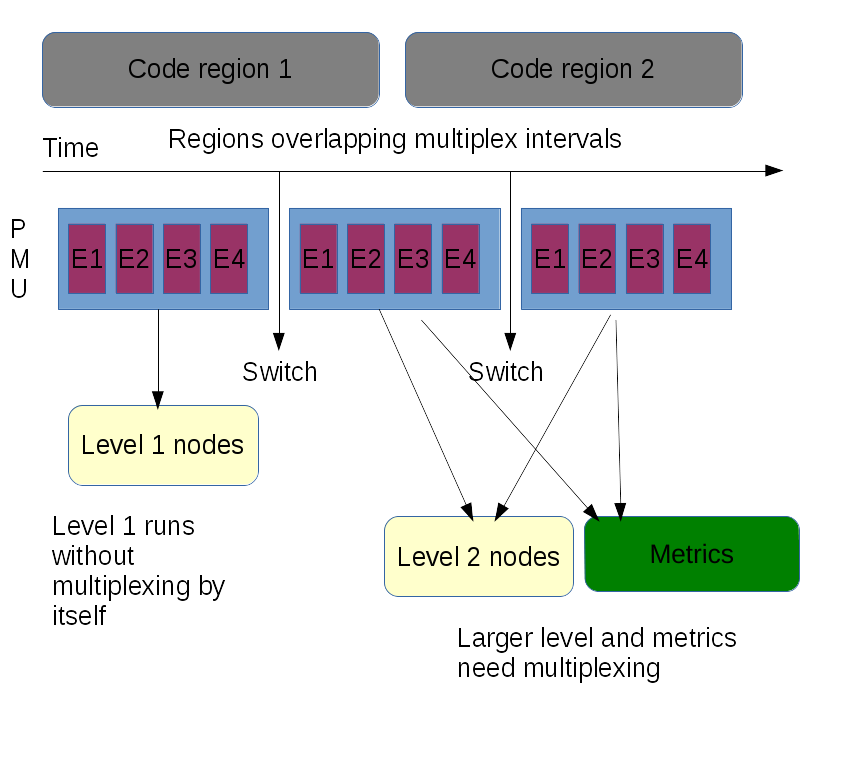
The Performance Monitoring Unit in the CPU has only a limited number of counters that can measure events at the same time. Any toplev run with level larger than one, or any additional CPU metrics enabled, needs more counters than are physically enabled. In this case the kernel driver will start multiplexing and regularly change the event groups every timer tick (between 1ms and 10ms, typically 2.5ms, depending on the kernel configuration) Multiplexing can cause measurement errors, as the formulas in several nodes in toplev need to correlate data from multiple groups. It works best on workloads that do the same thing over and over, but not so good when the workload executes many different short events.
For more details and for workarounds for problems see reasons for measuring issues.
Level 1 (```-l1``) and no metrics enabled should run without multiplexing, as long as no other workload using the PMU is active and no bug workarounds are active. It is usually a good idea to start analyzing without multiplexing.
Higher levels and metrics give additional information, but also adds multiplexing and thus can lead to more measurement errors.
If the workload is very repeatable multiplexing can be turned off with --no-multiplex.
This will rerun the workload as many times as needed.
Disabling HyperThreading in the BIOS doubles the number of generic counters and will
decrease multiplexing.
We are measuring some examples from beating the compiler. This is a tutorial that implements a simple problem -- summing an array of numbers -- first in a high level scripting language and then with increasingly optimized low level implementations. The code was all run on my Intel Core i7-4600U (Haswell) laptop with Turbo enabled.
Let us start with the simple python implementation.
def sum_naive_python():
    result = 0
    for i in data:
        result += i
    return result
We run this with level toplev, skipping the initialization phase (about 80 ms). This is a useful technique with short programs to get better measurements (I measured the initialization phase before by just printing the time at the top of the program)
In general it is more difficult to measure too short running programs (too many other effects dominate). In this case we tune the program to run at least for a few seconds by iterating the test 5000 times.
% toplev.py -D 80 -l1  --no-desc  --core C0 taskset -c 0  python first.py  numbers
..
C0    FE      Frontend_Bound:		  22.08%
C0    RET     Retiring:			75.01%
So Python is a little frontend bound, but has no other issues visible from toplev. Any improvements here would be likely at the algorithmic level (or using something faster than python).
We can look more closely at the frontend by increasing the level to 3. Note this can have drawbacks as it causes multiplexing. In this case it is safe as the workload runs long enough (we loop the benchmarked function 5000 times)
% toplev.py -D 80 -l3  --core C0 taskset -c 0  python first.py  numbers
...
C0    FE      Frontend_Bound:			 21.91%
C0    FE      Frontend_Bound.Frontend_Bandwidth:      15.91%
C0    FE      Frontend_Bound.Frontend_Bandwidth.DSB:  32.11%
	This metric represents Core cycles fraction in which CPU was
	likely limited due to DSB (decoded uop cache) fetch
	pipeline...
C0    RET     Retiring:			       74.97%
C0    RET     Retiring.Base:			  74.88%
The frontend bottleneck is the decoded uop cache. The descriptions are shortened,
use --long-desc to see longer descriptions.
Let us examine the second Python version from beating the compiler. The code
was all run on my Intel Core i7-4600U (Haswell) laptop with Turbo enabled. This version uses
the sum() builtin in Python to sum up the numbers, so that more execution is pushed
from the interpreter to the Python C core.
def sum_builtin_python():
    return sum(data)
In this case we also know the python
code is single-threaded (and the rest of the system is idle), so --single-thread
can be used which avoids the need for taskset and gives cleaner output:
% toplev.py --single-thread -l3 -D 80 python second.py   numbers
...
FE      Frontend_Bound:			 27.40%
FE      Frontend_Bound.Frontend_Bandwidth:      23.20%
FE      Frontend_Bound.Frontend_Bandwidth.DSB:  46.30%
	This metric represents Core cycles fraction in which CPU was
	likely limited due to DSB (decoded uop cache) fetch
	pipeline...
However this did not change the results much. Python is quite heavy-weight and taxes the front-end of the CPU significantly. But most of it runs at least in the decoded icache.
Now let us move on to a standard C implementation, which should be much faster:
int sum_simple(int* vec, size_t vecsize)
{
    int res = 0;
    int i;
    for (i = 0; i < vecsize; ++i) {
        res += vec[i];
    }
    return res;
}
This loop is compiled in a simple test harness with gcc 4.8.3 with optimization turned off and measured with toplev:
% toplev.py -l1 --single-thread --force-events ./c1-unoptimized  numbers
BE      Backend_Bound:		   60.34%
	This category reflects slots where no uops are being
	delivered due to a lack of required resources for accepting
	more uops in the Backend of the pipeline...
This version runs over 4 times faster than the Python version. The bottleneck has completely moved into the Backend. We can look at it more closely at Level 3:
% toplev.py -l3 --single-thread --force-events ./c1-unoptimized  numbers
BE      Backend_Bound:			  60.42%
BE/Mem  Backend_Bound.Memory_Bound:	     32.23%
BE/Mem  Backend_Bound.Memory_Bound.L1_Bound:    32.44%
	This metric represents how often CPU was stalled without
	missing the L1 data cache...
	Sampling events:  mem_load_uops_retired.l1_hit:pp,mem_load_uops_retired.hit_lfb:pp
BE/Core Backend_Bound.Core_Bound:	       45.93%
BE/Core Backend_Bound.Core_Bound.Ports_Utilization: 45.93%
	This metric represents cycles fraction application was
	stalled due to Core computation issues (non divider-
	related)...
It is both L1 bound and core bound. The L1 bound is likely because unoptimized
gcc code tends to store all variables on the stack, as it does not do full register
optimization. We can turn on the optimizer with -O2 and see what happens:
% toplev.py -l3 --single-thread ./c1-o2  numbers
RET     Retiring:			       83.66%
RET     Retiring.Base:			  83.62%
	This metric represents slots fraction where the CPU was
	retiring uops not originated from the microcode-sequencer...
	Sampling events:  inst_retired.prec_dist:pp
The L1 boundedness completely goes away and the workload spends most of the time retiring, which is good. This version is also ~85% faster than the unoptimized C version. Note these large benefits are somewhat of an extreme case and may totally vary on what the code does.
One way to optimize retiring would be to vectorize the code, and do more work on every instruction. In gcc -O3 enables the vectorizer. Unfortunately it is not able to vectorize our simple loop, due to a somewhat mysterious (from -ftree-vectorizer-verbose=2)
c1.c:9: note: not vectorized: not suitable for gather load _32 = *_31;
or with AVX2 enabled the even more mysterious:
c1.c:9: note: step unknown.
c1.c:9: note: reduction: not commutative/associative: _29 = (long unsigned int) i_36;
Update: As of gcc 5 gcc vectorizes this loop for AVX2.
Instead we can try roguelazer's hand optimized inline assembler AVX2 version from the original blog post. This should reduce Retiring, because it will do up to 8 additions in each SIMD instruction. In addition it uses aggressive unrolling. The code unfortunately is not compatible with my gcc 4.8 (needs 4.9+ for full AVX2 support), so I am building it with LLVM clang 3.5. Again the code speeds up dramatically, nearly an order of magnitude. Looking at the pipeline bottlenecks they have moved again.
% toplev.py -l3 --single-thread ./c-asm  numbers
BE      Backend_Bound:			  64.15%
BE/Mem  Backend_Bound.Memory_Bound:	      ...
BE/Mem  Backend_Bound.Memory_Bound.L1_Bound:    49.32%
	This metric represents how often CPU was stalled without
	missing the L1 data cache...
	Sampling events:  mem_load_uops_retired.l1_hit:pp,mem_load_uops_retired.hit_lfb:pp
BE/Mem  Backend_Bound.Memory_Bound.L3_Bound:    48.68%
	This metric represents how often CPU was stalled on L3 cache
	or contended with a sibling Core...
	Sampling events:  mem_load_uops_retired.l3_hit:pp
BE/Core Backend_Bound.Core_Bound:	       28.27%
BE/Core Backend_Bound.Core_Bound.Ports_Utilization: 28.27%
	This metric represents cycles fraction application was
	stalled due to Core computation issues (non divider-
	related)...
The retiring bottlenecks have disappeared and we finally see bandwith bottlenecks in the CPU, in this case nearly equally divided between L1 and L3. The rest is core execution.
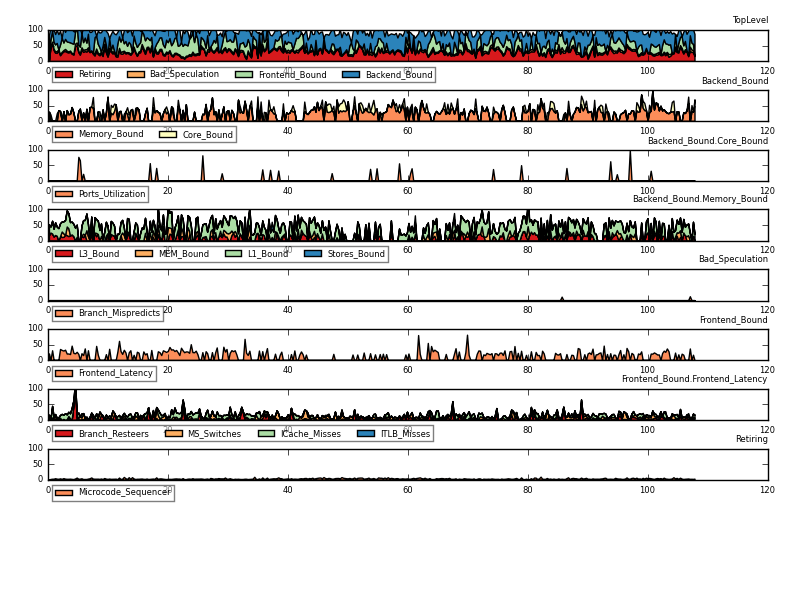
When analyzing more complex, less well understood workloads we typically need
to use intervals (using the -I option). The output then becomes too complicated
to be easily read. When not using the standard plot options in toplev we
can also use other programs, by using a comma-separated CSV file (with -x,)
For example looking at a Linux kernel build:
% toplev.py -I 1000 -l3 -x, -o tl-build.csv make
...
The resulting CSV file needs to be normalized, so that each measurement becomes a column. This can be done with interval-normalize.py.
% interval-normalize.py tl-build.csv > tl-build-n.csv
Then we can analyze it with standard toolkits, like R:
% R
...
> data <- read.csv("tl-build-n.csv")
When a server system has many CPUs the standard display of their results one by one may be difficult to parse. For this case toplev supports a --column mode that outputs results for all CPUs on the same line.
The --column mode is also supported for CSV output, which produces "normalized" output that is easier to process in many tools.
As mentioned earlier toplev is primarily a counting tool. But after a bottleneck has been identified it can be very useful to know where it happens, to make it possible to optimize the code. TopDown has an experimental feature to directly point to sampling events for specific bottlenecks to identify the actual code. This is implemented using sampling events. You may have seen the "Sampling events" lines in the example outputs earlier. These can be executed with ocperf (also in pmu-tools) to investigate a particular node. ocperf is a perf wrapper that resolves Intel event names.
% ocperf.py record -e mem_load_uops_retired.l1_hit:pp workload
% perf report
perf report then shows a histogram of the hottest code and allows browsing the assembler (or source) when available.
With the --show-sample option ocperf can also directly generate a suitable
command line to sample. With the --run-sample option it will also directly
run it. Note that this requires rerunning the workload (or taking another
interval when sleep X is used) and requires the workload to not change behavior much between iterations.
As a word of caution some of these events have considerable skid. All sampling is imprecise, as there is a delay from the even to triggering a sample, but during that time the state of the pipeline changes. The CPU can only sample when retiring an instruction, but the retiring the execution that caused the bottleneck may be far away from that point. Especially Frontend events tend to have a very high skid, but also others can be far away.
In general only PEBS events (ending with :pp) are reasonably accurate, but even those can have visible or even systematic skid. Skid can also cause shadow effects where some particular code is never sampled, even though it is a bottleneck.
In summary this means that even if you sample code, the performance issue could be somewhere else. Often it is nearby or there though.
Plotting requires installing matplotlib first.
toplev supports plotting the output as a time series with --graph . It can only plot one logical CPU thread at a time. The CPU can be set with the --graph-cpu option, for example --graph-cpu C0-T0. The graph title can be set with --title title. When an output file is specified with -o file.png the graph is written as png to the output file, otherwise the plot is shown as a window.
The plotting is implemented with the tl-barplot.py tool, which can also be called directly to plot existing toplev output CSV files. This is useful when multiple CPUs should be plotted from the same measurement run.
This example plots the two threads of the first core on a hyper threaded system:
toplev.py -l3 -I 100 -x, -o x.csv workload
tl-barplot.py --cpu C0-T0 -o workload-c0-t0.png
tl-barplot.py --cpu C0-T1 -o workload-c0-t1.png
To analyze the plots it is useful to know on which CPUs the workload is running on. This can be ensured by setting the CPU affinity using taskset(1).
An alternative is also to use --single-thread: if the workload is single threaded and the rest of the system is idle.
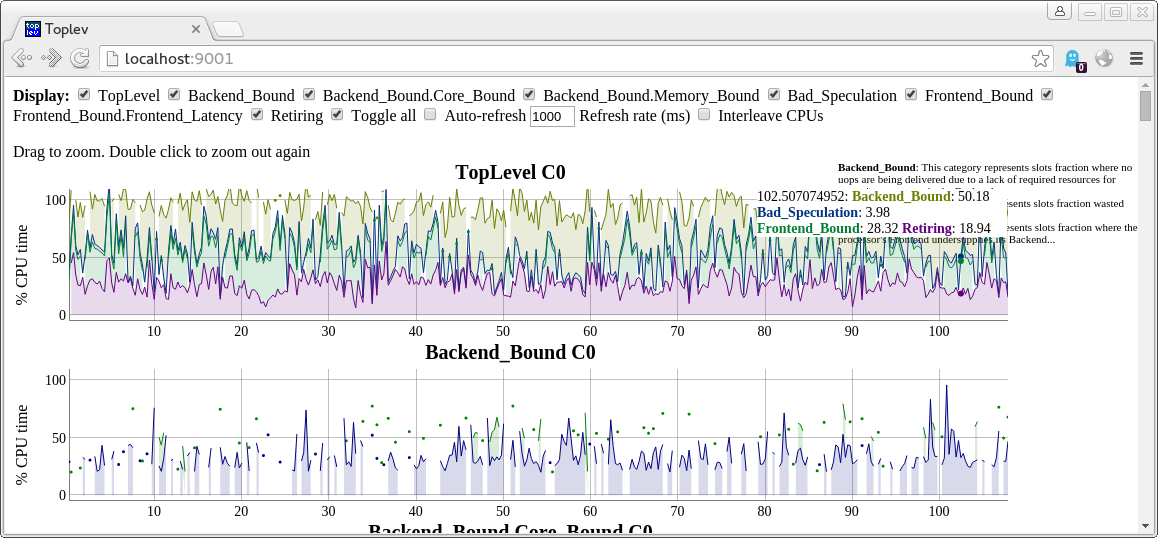
There is also an experimental tl-serve tool to plot in a web browser using dygraph, which supports displaying multiple CPUs at the same time and changing the plotting interactively.
tl-serve requires downloading dygraph once:
wget http://dygraphs.com/1.0.1/dygraph-combined.js
Then it can be run to serve plots of toplev CSV files:
toplev.py -x, -I 100 -o x.csv workload &
tl-serve.py x.csv
Then connect a web browser to localhost:9001
tl-serve supports refreshing the data file continuously when it runs in parallel to toplev, but there is currently no expiring of old data.
The plotting tools have various problems at the moment. Any contributions in this area would be appreciated.
toplev can generate an XLSX Excel file with the --xlsx FILE.xlsx argument. It will automatically measure the whole system and present the data in different aggregations (per thread, per core, per socket if applicable). With --xchart it will also automatically add plots. With --xnormalize it will add additional sheets with normalized data.
    $ toplev -l3 --metrics --xlsx file.xlsx --xchart --xnormalize ./workloads/CLANG10s
    $ gnumeric file.xlsx
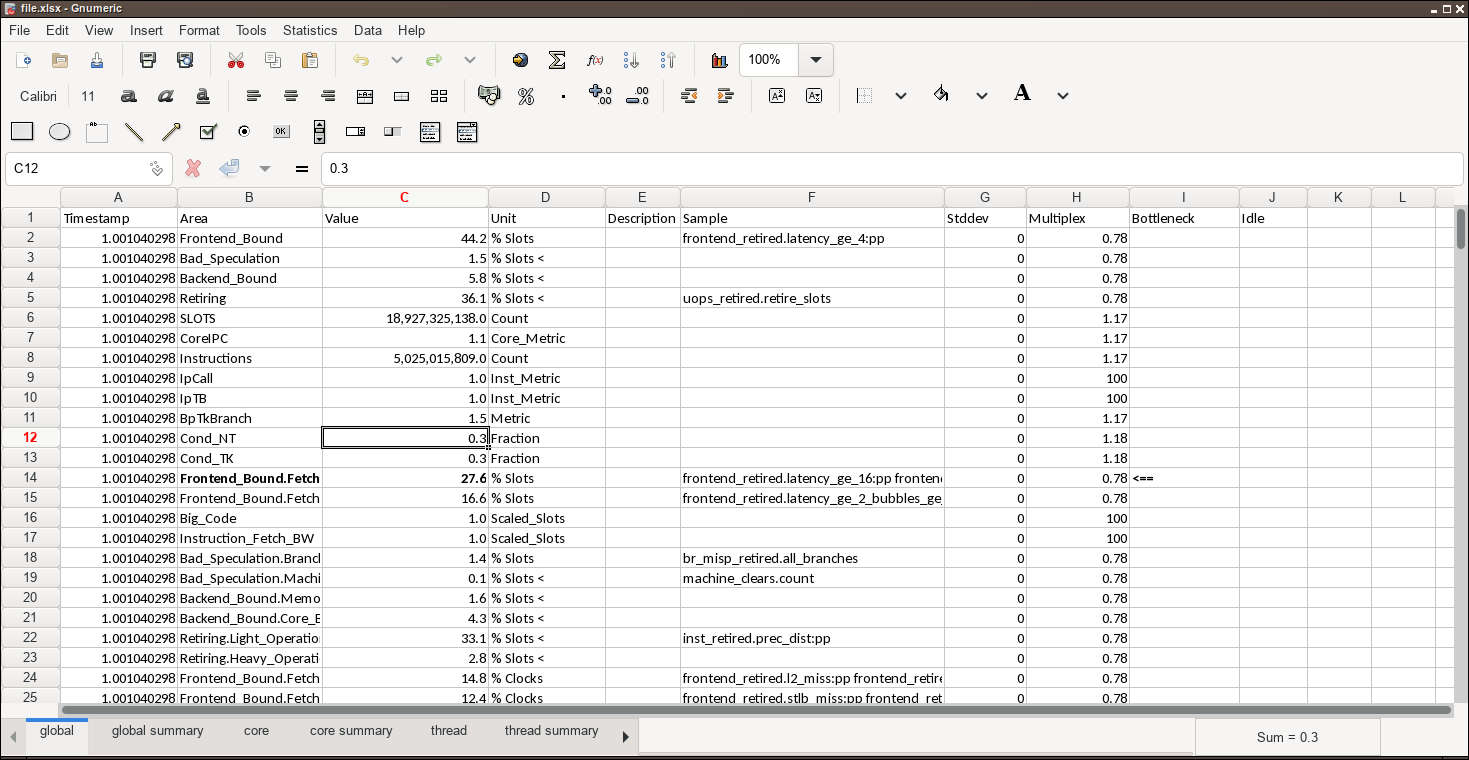
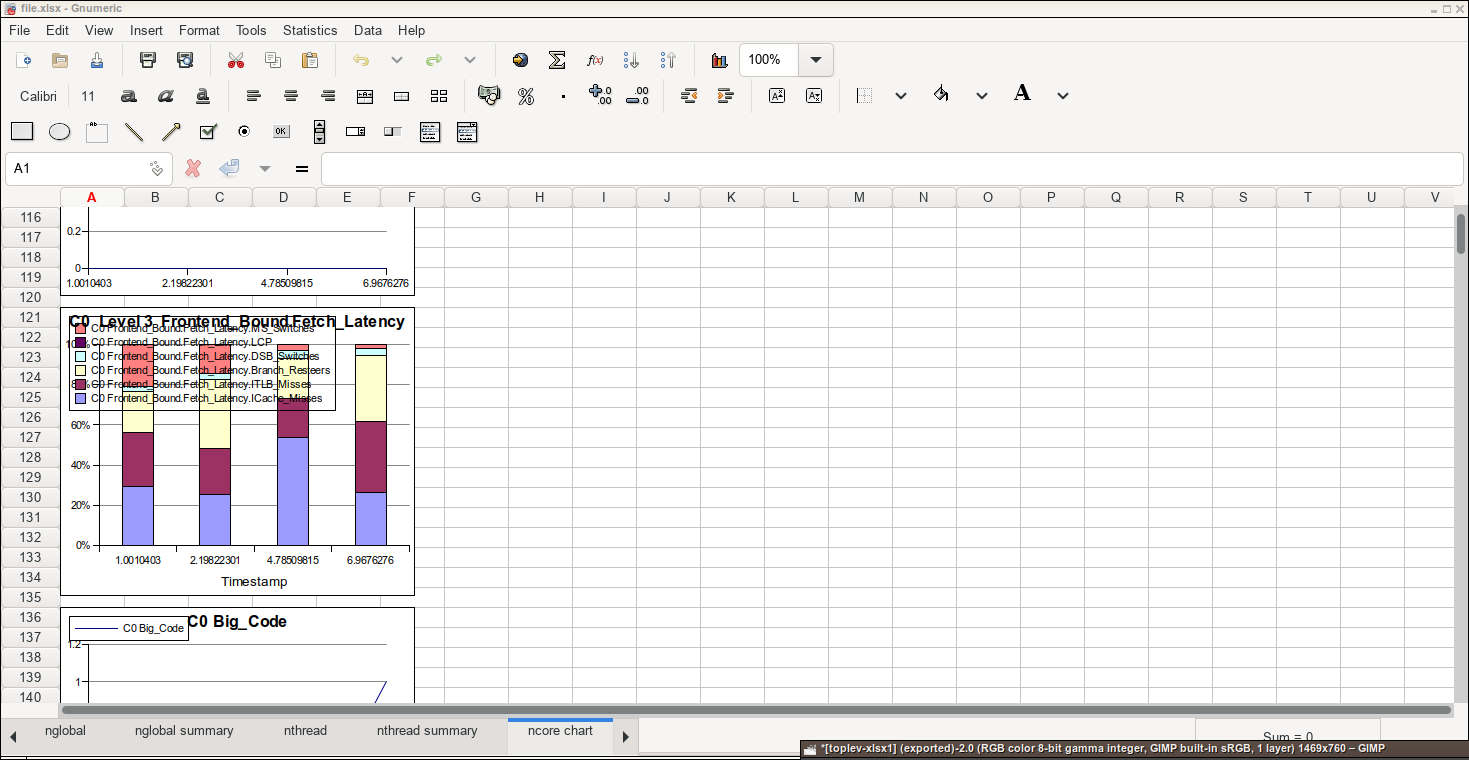
On Linux I recommend using gnumeric as viewer, it is much faster opening the files than OpenOffice. On Windows Excel works of course, as well as Google Office.
toplev can generate collection scripts with --gen-script which can be run on other systems without pmu-tools (but with working Linux perf). The output can be imported with --import / --topology / --cpuinfo. Note the generation and input command line options need to match. It may also be needed to force the CPU using --force-cpu, or importing the cpuinfo/topology generated by an earlier script run with --topology when generating the next script.
Also available with toplev.py --help
   General operation:
   --interval INTERVAL, -I INTERVAL
                        Measure every ms instead of only once
   --no-multiplex        Do not multiplex, but run the workload multiple times
                         as needed. Requires reproducible workloads.
   --single-thread, -S   Measure workload as single thread. Workload must run
                         single threaded. In SMT mode other thread must be
                         idle.
   --fast, -F            Skip sanity checks to optimize CPU consumption
   --import IMPORT_      Import specified perf stat output file instead of
                         running perf. Must be for same cpu, same arguments,
                         same /proc/cpuinfo, same topology, unless overriden
   --subset SUBSET       Process only a subset of the input file with --import.
                         Valid syntax: a-b. Process from seek offset a to b. b
                         is optional. x/n% process x'th n percent slice. Starts
                         counting at 0. Add - to process to end of input.
                         sample:n% Sample each time stamp in input with n%
                         (0-100%) probability. toplev will automatically round
                         to the next time stamp boundary.
   --parallel            Run toplev --import in parallel in N processes, or the
                         system's number of CPUs if 0 is specified
   --pjobs PJOBS         Number of threads to run with parallel. Default is
                         number of CPUs.
   --gen-script          Generate script to collect perfmon information for
                         --import later
   --script-record       Use perf stat record in script for faster recording or
                         import generated perf.data (requires new perf)
   --drilldown           Automatically rerun to get more details on bottleneck
   --show-cpu            Print current CPU type and exit

  Select events:
   --level LEVEL, -l LEVEL
                         Measure upto level N (max 6)
   --metrics, -m         Print extra metrics
   --sw                       Measure perf Linux metrics
   --no-util             Do not measure CPU utilization
   --tsx                 Measure TSX metrics
   --all                 Measure everything available
   --frequency           Measure frequency
   --power               Display power metrics
   --nodes NODES         Include or exclude nodes (with + to add, -|^ to
                         remove, comma separated list, wildcards allowed, add *
                         to include all children/siblings, add /level to
                         specify highest level node to match, add ^ to match
                         related siblings and metrics, start with ! to only
                         include specified nodes)
   --reduced             Use reduced server subset of nodes/metrics
   --metric-group METRIC_GROUP
                         Add (+) or remove (-|^) metric groups of metrics,
                         comma separated list from --list-metric-groups.
   --pinned              Run topdown metrics (on ICL+) pinned
   --exclusive           Use exclusive groups. Requires new kernel and new perf
   --thread              Enable per thread SMT measurements for pre-ICL, at the
                         cost of more multiplexing.

  Measurement filtering:
   --kernel              Only measure kernel code
   --user                Only measure user code
   --core CORE           Limit output to cores. Comma list of Sx-Cx-Tx. All
                         parts optional.
   --no-aggr, -A         Measure every CPU
   --cputype {atom,core}
                         Limit to hybrid cpu type (atom or core)

  Query nodes:
   --list-metrics        List all metrics. Can be followed by prefixes to
                         limit, ^ for full match
   --list-nodes          List all nodes. Can be followed by prefixes to limit,
                         ^ for full match
   --list-metric-groups  List metric groups.
   --list-all            List every supported node/metric/metricgroup. Can be
                         followed by prefixes to limit, ^ for full match.
   --describe            Print full descriptions for listed node prefixes. Add
                         ^ to require full match.

  Workarounds:
   --no-group            Dont use groups
   --force-events        Assume kernel supports all events. May give wrong
                         results.
   --ignore-errata       Do not disable events with errata
   --handle-errata       Disable events with errata

  Output:
   --per-core            Aggregate output per core
   --per-socket          Aggregate output per socket
   --per-thread          Aggregate output per CPU thread
   --global              Aggregate output for all CPUs
   --no-desc             Do not print event descriptions
   --desc                Force event descriptions
   --verbose, -v         Print all results even when below threshold or
                         exceeding boundaries. Note this can result in bogus
                         values, as the TopDown methodology relies on
                         thresholds to correctly characterize workloads. Values
                         not crossing threshold are marked with <.
   --csv CSV, -x CSV     Enable CSV mode with specified delimeter
   --output OUTPUT, -o OUTPUT
                         Set output file
   --split-output        Generate multiple output files, one for each specified
                         aggregation option (with -o)
   --graph               Automatically graph interval output with tl-barplot.py
   --graph-cpu GRAPH_CPU
                         CPU to graph using --graph
   --title TITLE         Set title of graph
   --quiet               Avoid unnecessary status output
   --long-desc           Print long descriptions instead of abbreviated ones.
   --columns             Print CPU output in multiple columns for each node
   --json                Print output in JSON format for Chrome about://tracing
   --summary             Print summary at the end. Only useful with -I
   --no-area             Hide area column
   --perf-output PERF_OUTPUT
                         Save perf stat output in specified file
   --perf-summary PERF_SUMMARY
                        Save summarized perf stat output in specified file
   --perf                Print perf command line
   --print               Only print perf command line. Don't run
   --idle-threshold IDLE_THRESHOLD
                         Hide idle CPUs (default <5% of busiest if not CSV,
                         specify percent)
   --no-output           Don't print computed output. Does not affect
                         --summary.
   --no-mux              Don't print mux statistics
   --abbrev              Abbreviate node names in output

  Environment:
    --force-cpu {snb,jkt,ivb,ivt,hsw,hsx,slm,bdw,bdx,simple,skl,knl,skx,clx,icl,tgl,icx}
                        Force CPU type
    --force-topology findsysoutput
                        Use specified topology file (find /sys/devices)
    --force-cpuinfo cpuinfo
                        Use specified cpuinfo file (/proc/cpuinfo)
    --force-hypervisor    Assume running under hypervisor (no uncore, no
                         offcore, no PEBS)
    --no-uncore           Disable uncore events
    --no-check            Do not check that PMU units exist

  Additional information:
   --print-group, -g     Print event group assignments
   --raw                 Print raw values
   --valcsv VALCSV, -V VALCSV
                         Write raw counter values into CSV file
   --stats               Show statistics on what events counted

  xlsx output:
   --xlsx XLSX           Generate xlsx spreadsheet output with data for
                         socket/global/thread/core/summary/raw views with 1s
                         interval. Add --single-thread to only get program
                         output.
  --xnormalize          Add extra sheets with normalized data in xlsx files
  --xchart              Chart data in xlsx files
  --keep                Keep temporary files

  Sampling:
   --show-sample         Show command line to rerun workload with sampling
   --run-sample          Automatically rerun workload with sampling
   --sample-args SAMPLE_ARGS
                         Extra arguments to pass to perf record for sampling.
                         Use + to specify -
   --sample-repeat SAMPLE_REPEAT
                         Repeat measurement and sampling N times. This
                         interleaves counting and sampling. Useful for
                         background collection with -a sleep X.
   --sample-basename SAMPLE_BASENAME
                         Base name of sample perf.data files

  Other perf arguments allowed (see the perf documentation)
After -- perf arguments conflicting with toplev can be used.
For problems downloading event files see running toplev when not on the internet.
For problems with the kernel support or toplev tells you it is disabling nodes see kernel support.
Finally if the results are not as expected please see reasons for measuring issues.
VTune Amplifier (not open-source) supports TopDown for sampling, and a range of other analysis methods on Intel CPUs. Unlike toplev it is an officially supported Intel product which also runs on other operating systems.
toplev / pmu-tools is written by Andi Kleen. The TopDown / TMA methodology is developed by Ahmad Yasin. Oliver Frommel helped with the manual. Thanks to everyone who reported bugs and submitted patches.