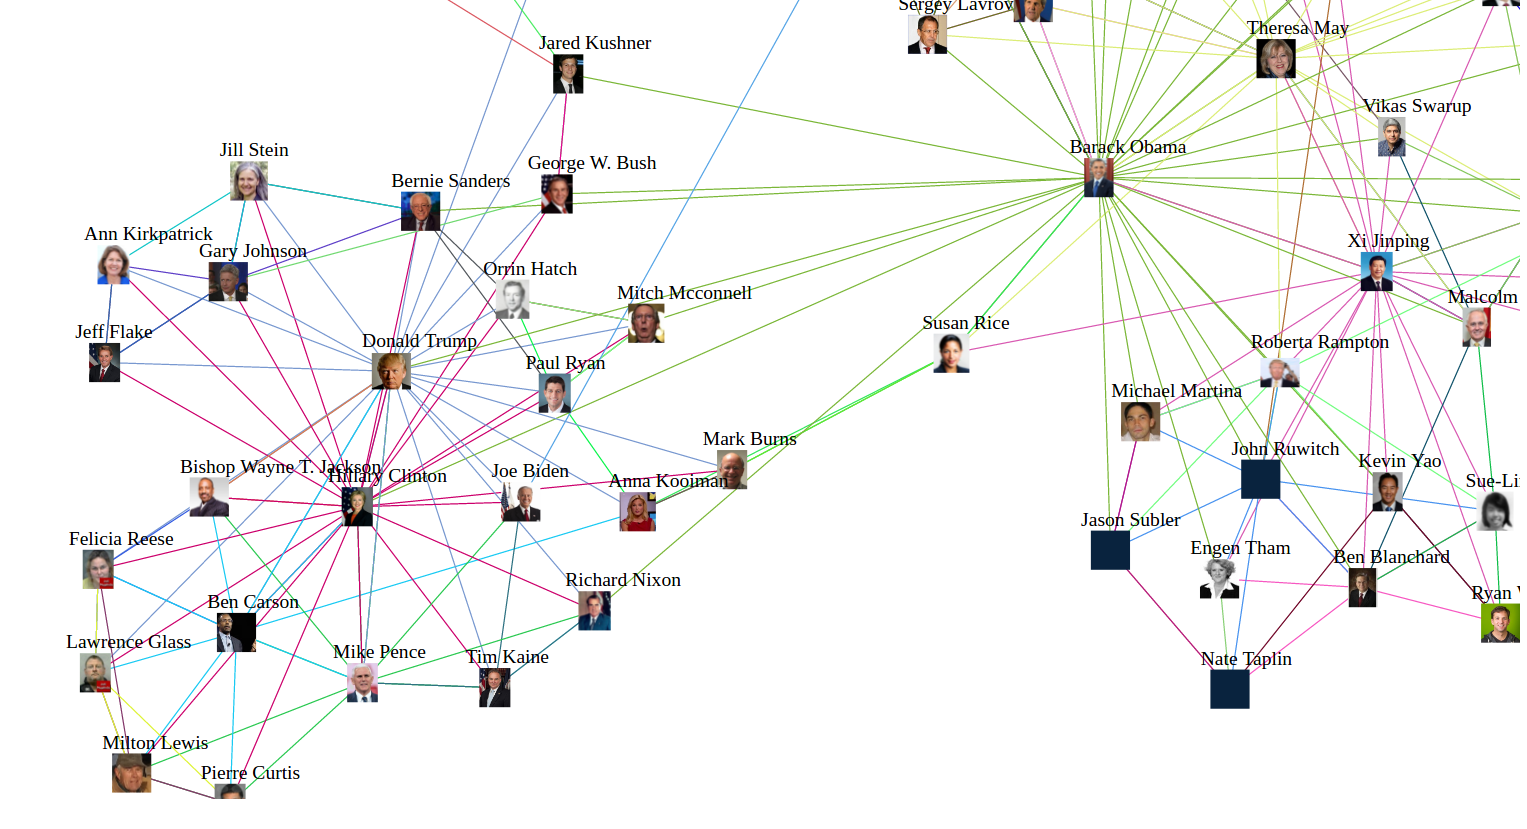
What do you get when you count the most frequently mentioned personalities in articles that also mention Hillary Clinton? A list of names. But, what do you get when you run the same process for each of these names over and over again? A list of lists of names. But what do you get when you draw a graph of the connected names using a cool Javascript library?
I’m sure you’ve asked yourself these questions before (who hasn’t?). In any case, ponder no further, for I’ve taken the time to hack a script that does just that! I’ve created a short Python script that queries webhose.io for news and blog articles that mention Hillary Clinton. The Webhose.io API returns the mentioned personalities in each article, and the script indentifies the top 5 people mentioned. The script runs for each mentioned personality, until it reaches a list of 100 names. I plugged the dataset into the VivaGraphJS library, and plotted the list into a cool blob of a graph.
https://webhose.io/demo/cool-useless-demo
Granted, at first sight it appears interesting and useful, but as I sat down to explain what I had created, I wasn’t quite sure why anyone would want to know how Donald Trump is connected to Taylor Swift. Apparently she is supporting him. Don’t get me started.
But I digress. Since Webhose.io provides other types of entities, you can easily customize the script to visualize relationships between companies or locations. If you’d like to learn more about how the script works (which means you have some coding skills), keep reading. If not, you are more than welcome to play with the graph, and maybe you will find it useful (doubt it).
If you want to run your own experiments, just follow these steps:
The Python script that produces the JSON for both the persons connected list, and their respective images. To run the script you need two access tokens, one for the webhose.io API that you can obtain by creating a free account. The second is also free for Bing Image Search API.
Set your Webhose.io access token on the following line:
webhose.config(token=YOUR_API_KEY)and your Bing Image Search API key on the following line of code:
'Ocp-Apim-Subscription-Key': 'XXXXXXXXXXXXXXXXXXXXXXXXXXXXXXXXXXX',The first entity the script extract is “Hillary Clinton”, but you can change it. I’ve set a hard limit of 100 entities to explore, but you can of course increase or decrease this limit as you wish by changing the following code:
if len(output) == 100:The script runs multiple requests against Webhose.io API for documents from the past 30 days. I’m using the &ts (timestamp) parameter to tell Webhose.io to return results from 30 days ago to the present. Each request returns up to 100 posts, and each post contains the mentioned entities in the article. Here is the query I’ve used:
persons:"top_person" domain_rank:<10000Where top_person is to be replaced with the person you are looking for. The domain_rank filter tells Webhose.io to look only in sites that are ranked in the top 10,000 world wide. By the way, if you want to extract other types of entities just replace “persons” with either “organization” or “location” and count the relevant entity. Read Webhose.io tutorial and documentation to learn more about how to use the API.
I’ve used Bing search API, to retrieve the faces of the mentioned persons. Note that if you want images other than faces, you need to remove the image type from this line:
params = urllib.urlencode({"q":'"' + search_string + '"', "count":10,"offset":0,"mkt":"en-us", "size":"small", "imageType":"Photo","imageContent":"Face"})Now all you have to do is to run the script: .. code-block:: bash
# python extract_entities.py
And wait. When the script is done it will print two JSON strings, the first is for the list of names and their respective connections, and the second one is a list of names and the associated image.
I’m relying on VivaGraphJS for the graphical interface, so make sure you download it and set the correct path.
<script src="../../dist/vivagraph.js"></script>Paste the persons JSON output from the Python script on: .. code-block:: python var persons = {}
And the images JSON here: .. code-block:: python var images = {}
That’s it - you are all set. You can play with the script, extract and plot people relationships, or change the script and extract relationships between companies or locations.