/
gis.Rmd
232 lines (124 loc) · 12.2 KB
/
gis.Rmd
1
2
3
4
5
6
7
8
9
10
11
12
13
14
15
16
17
18
19
20
21
22
23
24
25
26
27
28
29
30
31
32
33
34
35
36
37
38
39
40
41
42
43
44
45
46
47
48
49
50
51
52
53
54
55
56
57
58
59
60
61
62
63
64
65
66
67
68
69
70
71
72
73
74
75
76
77
78
79
80
81
82
83
84
85
86
87
88
89
90
91
92
93
94
95
96
97
98
99
100
101
102
103
104
105
106
107
108
109
110
111
112
113
114
115
116
117
118
119
120
121
122
123
124
125
126
127
128
129
130
131
132
133
134
135
136
137
138
139
140
141
142
143
144
145
146
147
148
149
150
151
152
153
154
155
156
157
158
159
160
161
162
163
164
165
166
167
168
169
170
171
172
173
174
175
176
177
178
179
180
181
182
183
184
185
186
187
188
189
190
191
192
193
194
195
196
197
198
199
200
201
202
203
204
205
206
207
208
209
210
211
212
213
214
215
216
217
218
219
220
221
222
223
224
225
226
227
228
229
230
231
232
---
title: "GIS basics"
output: html_document
---
```{r setup, include=FALSE}
knitr::opts_chunk$set(echo = TRUE)
```
# Geographic Information Systems
> **Geographic Information Systems (GIS)**: computer based systems used to:
> - collect
- store
- manage
- analyse
- display
spatial or geographic data
In science, GIS allow us to examine spatial realationships, patterns and processes.
Applied to a broad range of phenomena: from physical, biological to cultural and demographic.
# Geospatial Data
## Geospatial data types
Most common spatial data types:
- **raster:** gridded data
- **vector:** geographical feautures
- points
- lines
- polygons
**Vector data** tends to dominate the **social sciences** because human settlements tend to have **discrete borders**.
**Raster** often dominates in **environmental sciences** because of the reliance on **remote sensing** data.
There is much overlap in some fields and **raster and vector datasets can be used side-by-side**: ecologists and demographers, for example, commonly use both vector and raster data.
### Geospatial data = data + spatial metadata
Ultimately they are just **data with geographic metadata attached** to it in a structured way that both locates the data and also makes it interoperable.
One of the most important aspects of this georgraphic metadata is the **Coordinate Reference System** being used.
---
# Coordinate Reference Systems
Coordinate Reference Systems (CRS) provide a framework for defining real-world locations.
The basis for any Coordinate reference system is a **model of the earth (Globe Model)** on which locations can be defined.
We can think of the differences between Globe Models as being analogous to differences in globes you’ve actually seen in your life – some are perfect balls, while others are spheres with elevations, while others capture the full weirdness of the earth’s shape.

## Types of common coordinate systems
There are two types of Coordinate Reference Systems:
- **Geographic coordinate system (GCS)**: A global or spherical coordinate system such as latitude-longitude.
- **Projected coordinate systems (PCS)**: A projected coordinate system provides various mechanisms to project maps of the earth's spherical surface onto a two-dimensional Cartesian coordinate plane. Projected coordinate systems are referred to as map projections.
## Geographic Coordinate System
Geographic Coordinate Systems are defined by a **Datum**
A **Datum** essentially defines the Globe Model of the coordinate system.
It has:
- **angular units (eg. degrees)**
- defines a **starting point** (i.e. where is (0,0) in particular which longitude is defined to be 0°?), so the angles reference a meaningful spot on the earth.
- defines the **position of the spheroid relative to the center** of the earth and therefore the origin and orientation of latitude and longitude lines.
**A point is referenced by its longitude and latitude values.** Longitude and latitude are angles measured from the earth's center to a point on the earth's surface.

_Image source: <https://datacarpentry.org/r-raster-vector-geospatial/images/map_usa_different_projections.jpg>_
### The right datum for the right job
A particular datum can be selected for use in a specific geographic area, because it does a good job of modelling the surface of the earth in that part of the world.
_Image source: <http://desktop.arcgis.com/en/arcmap/10.3/guide-books/map-projections/GUID-E94B3A5F-D997-4E6F-B400-BC15C4B0DCDC-web.gif>_
> Orange Peel Analogy: a datum is your choice of fruit to use in the orange peel analogy. Is the earth an orange, a lemon, a lime, a grapefruit?

_Image source: <https://farm3.staticflickr.com/2260/2508805118_500f5bba28_n.jpg>_
### Common Datums
- [**WGS 84 - the World Geodetic System of 1984:**](https://en.wikipedia.org/wiki/World_Geodetic_System) The WGS 84 datum is the only world referencing system in place today. WGS 84 is the default standard datum for coordinates stored in recreational and commercial GPS units.
- [**NAD 83 - The North American Datum of 1983:**](https://en.wikipedia.org/wiki/North_American_Datum) is the datum now used to define the geodetic network in North America
### Geographic (datum) transformations
To change between geographic coordinate system, you may need to perform a **geographic (datum) transformation**. This is a well-defined mathematical method to convert coordinates between two geographic coordinate systems.
## Projected coordinate systems (PCS)
Projected coordinate systems include **a projection**
A Projection is a mathematical transformation of the angular measurements on a round earth to a flat surface (i.e. paper or a computer screen).
Units of measurement are linear, usually meters.
> Orange Peel Analogy: a projection is how you peel your orange and then flatten the peel.

_Image source: <http://blogs.lincoln.ac.nz/gis/2017/03/29/where-on-earth-are-we/>_
<br>
### Common projected coordinate systems:
-[**Mercator projection:**](https://en.wikipedia.org/wiki/Mercator_projection) a cylindrical map projection presented by the Flemish geographer and cartographer Gerardus Mercator in 1569. It became the standard map projection for nautical purposes because of its ability to represent lines of constant course as straight segments that conserve the angles with the meridians.
- [**Universal Transverse Mercator (UTM) system**](https://en.wikipedia.org/wiki/Universal_Transverse_Mercator_coordinate_system): The UTM system is not a single map projection. The system instead divides the Earth into **sixty zones**, each being a **six-degree band of longitude**, and uses a secant transverse Mercator projection in each zone.
- [**Albers Equal Area**](https://en.wikipedia.org/wiki/Albers_projection): a conic, equal area map projection that uses two standard parallels. Although scale and shape are not preserved, distortion is minimal between the standard parallels.

_Image source: <https://datacarpentry.org/r-raster-vector-geospatial/images/map_usa_different_projections.jpg>_
<br>
#### Q: Why is WGS 84 so different to other three projected maps?
Latitude lines are concentric circles that become smaller near the poles. They form a single point at the poles.

When a lat/lon CRS is flattened, the implicit flattening function used is the [Plate Carree](Equirectangular projection) Function, one of the simplest functions that simply turns the globe into a cylinder and then unwraps it, resulting in increasing distortion of features as one approaches the poles.
#### Q: Why do the three projected maps differ from each other?
Going back to the orange peel analogy, different projections use a different starting point and method to peel the earth's surface into a flat surface.
<br>
#### Map reprojections
To change between projected CRSs you need to **reproject** your data. This often involves unprojecting back to lat/lon, transforming the unprojected coordinates and then reprojecting.
___
# Notation for Coordinate Reference Systems in R
You have two options for identifying a CRS in most R commands. The documentation for a command that requires projection information will tell you which is required. Often you can choose between the two options.
## EPSG Code
An EPSG (European Petroleum Survey Group) Code is an ID that has been assigned to most common projections to make reference to a particular projection easy. An EPSG Code is also called an SRID (Spatial Reference Identifier). Technically, EPSG is the authority that assigns SRIDs, but you will hear these terms used interchangibly.
### pros/cons
The main advantages to using this method of specifying a projection are that it is standardized and ensures you have the same parameters every time.
The disadvantage is that if you need to know the parameters used by the projection or it's name, you have to look them up, but that's fairly easy to to at [spatialreference.org](http://spatialreference.org/ref/epsg/). Also, you can't customize the parameters if you use an EPSG code.
## PROJ.4 String
PROJ.4 is an open source library for defining and converting between coordinate reference systems. It defines a standard way to write projection parameters.
For example, the proj.4 string: `+proj=longlat +datum=WGS84 +no_defs +ellps=WGS84 +towgs84=0,0,0` encodes:
- **proj=longlat:** the data are in a geographic (latitude and longitude) coordinate system
- **datum=WGS84:** the datum WGS84 (the datum refers to the 0,0 reference for the coordinate system used in the projection)
- **ellps=WGS84:** the ellipsoid (how the earth’s roundness is calculated) is WGS84
_Note that there are no specified units above. This is because this geographic coordinate reference system is in latitude and longitude which is most often recorded in decimal degrees._
### pros/cons
Two important advantages to using this option are:
1. the parameters are human-readable and immediately transparent
2. the strings are easily customized.
The main disadvantage to this option is that it's easy to make a mistake when you reproduce the string, accidentally changing parameters.
For more, check out [Proj4 FAQs](http://proj.maptools.org/faq.html)
### The most common mistake to beware of:
You may find yourself in a situatation were you'll need to tell your GIS (in our case R) what the projection/CRS of your data should be. In these cases, the GIS needs to know what the projection/CRS **currently** is, not what you would like it to be. If you need to change a projection, you need to go through a different process, often called Re-project or Transform.
## A motivating example
#### (from Geocomputation in R, [Section 2.1](https://geocompr.robinlovelace.net/spatial-class.html#vector-data)):
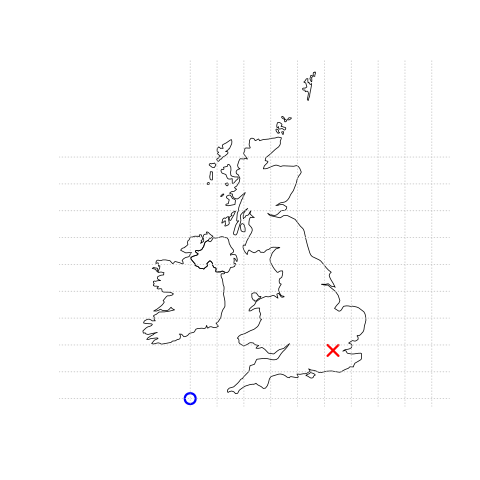
The city of London can be represented by the coordinates c(-0.1, 51.5). This means that its location is **-0.1 degrees east** and **51.5 degrees north** of the **origin**. The origin in this case is at 0 degrees longitude (the Prime Meridian) and 0 degree latitude (the Equator) in a geographic (‘lon/lat’) coordinate system (GCS).
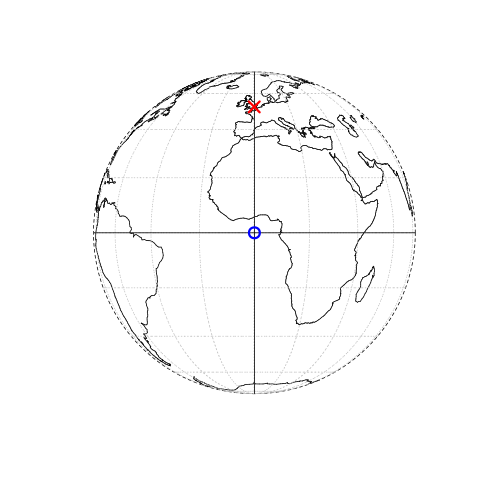
The same point could also be approximated in a **PCS** with **‘Easting/Northing’ values of c(530000, 180000)** in the **British National Grid (BNG)**, meaning that London is located 530 km East and 180 km North of the origin of the CRS (right panel).
The location of BNG’s origin, in the sea beyond South West Peninsular, ensures that most locations in the UK have positive Easting and Northing values.
### Sources and inspiration for this section:
- [R Projections Workshop](https://github.com/MicheleTobias/R-Projections-Workshop) by Michele Tobias
- [How Computers Relate x-y Coordinates to Real Locations on Earth](http://www.nickeubank.com/wp-content/uploads/2018/02/CoordinateSystems_And_Projections.pdf): by Nick Eubank
- [Geocomputation in R](https://geocompr.robinlovelace.net/spatial-class.html#vector-data)
### more advice from twitter experts
<blockquote class="twitter-tweet" data-lang="en"><p lang="en" dir="ltr">What's the one thing you want people who are learning to handle projections for spatial data in <a href="https://twitter.com/hashtag/rstats?src=hash&ref_src=twsrc%5Etfw">#rstats</a> (or in general) to know? <a href="https://twitter.com/hashtag/gistribe?src=hash&ref_src=twsrc%5Etfw">#gistribe</a></p>— Dr. Michele M Tobias (@MicheleTobias) <a href="https://twitter.com/MicheleTobias/status/955861280174174208?ref_src=twsrc%5Etfw">January 23, 2018</a></blockquote>
<script async src="https://platform.twitter.com/widgets.js" charset="utf-8"></script>