3个y轴时,右侧两个y轴重叠,而position无法调整这种情况! #3836
Comments
|
|
|
感谢反馈,当前暂时不支持多轴的情况,这个点在 G2 5.0 新架构中考虑。 |
Sign up for free
to join this conversation on GitHub.
Already have an account?
Sign in to comment
|
|
|
感谢反馈,当前暂时不支持多轴的情况,这个点在 G2 5.0 新架构中考虑。 |
What problem does this feature solve?
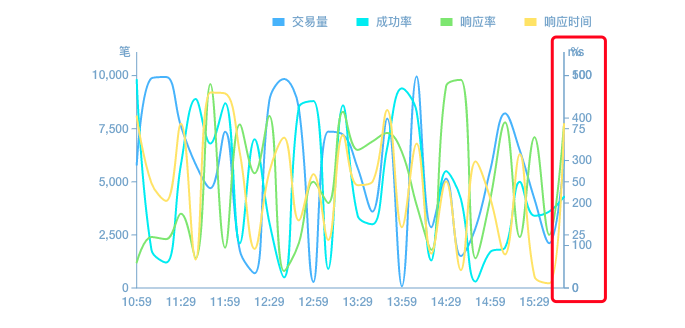
我现在有一个多维分析的数据需要放在同一个图表中,例如分析维度有交易量、响应时间、成功率和响应率,这是折线图就需要3个y轴来实现,现在G2只能实现2个y轴,当第3个维度Y轴绘制时会和右侧的y轴重叠,并且api提供的axis-position无法解决这个问题!
What does the proposed API look like?
希望将position扩展为方向上的数值偏移,或者提供offsetY和offsetX来修改y轴的位置。
The text was updated successfully, but these errors were encountered: