数据都是负数的时候对比例尺设置最大值失效 #4412
Comments
|
max min 都会和具体的数据进行比较之后再做处理。如果强制按照用户设置的来处理,那就用这个: chart.scale('value', {
maxLimit: -50, // 👈🏻
// minLimit: 10,
}); |
|
感谢,确实有效 |
Sign up for free
to join this conversation on GitHub.
Already have an account?
Sign in to comment
代码如下:
设置比例尺的最大值为 -50,预期情况是,什么都不显示,因为所有值都比 -50 大,就像这样:
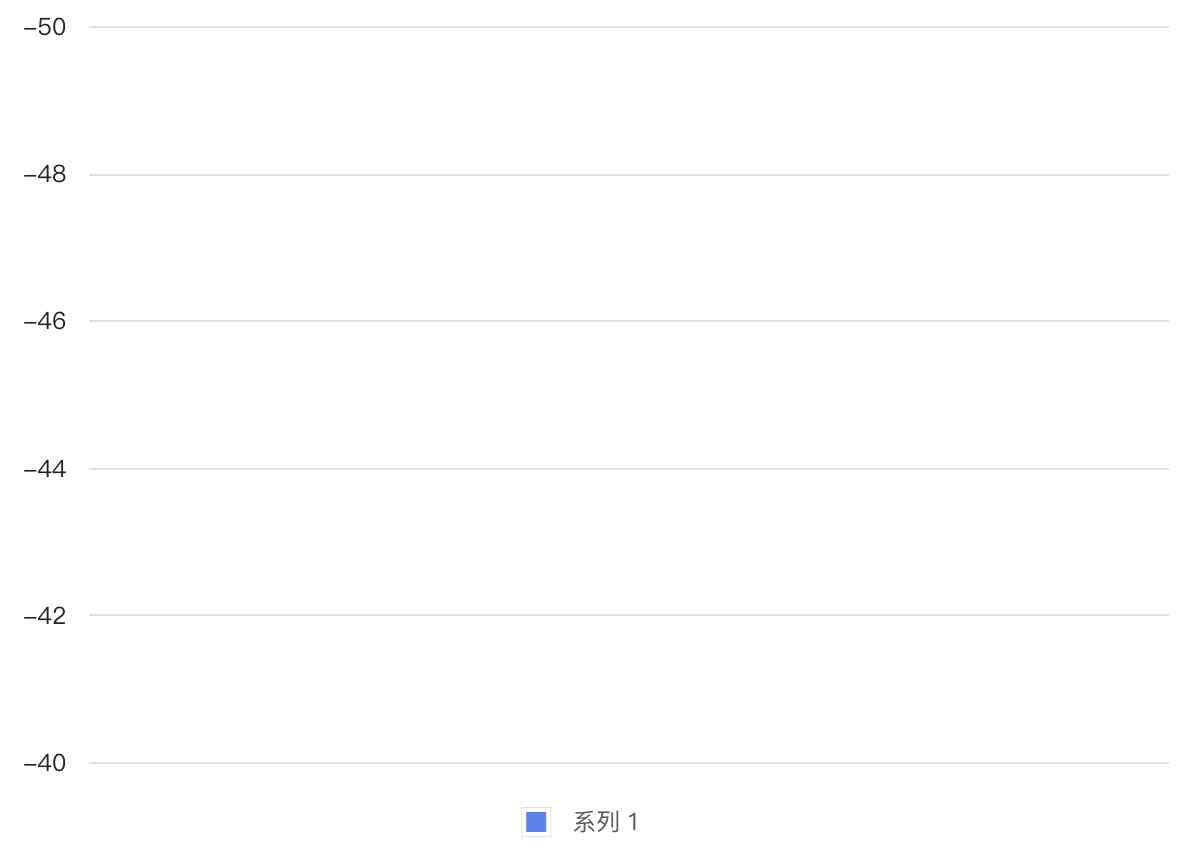

然而官网复现出来,是这样:
看起来只隐藏了第一个数据,其他的没反应。
The text was updated successfully, but these errors were encountered: