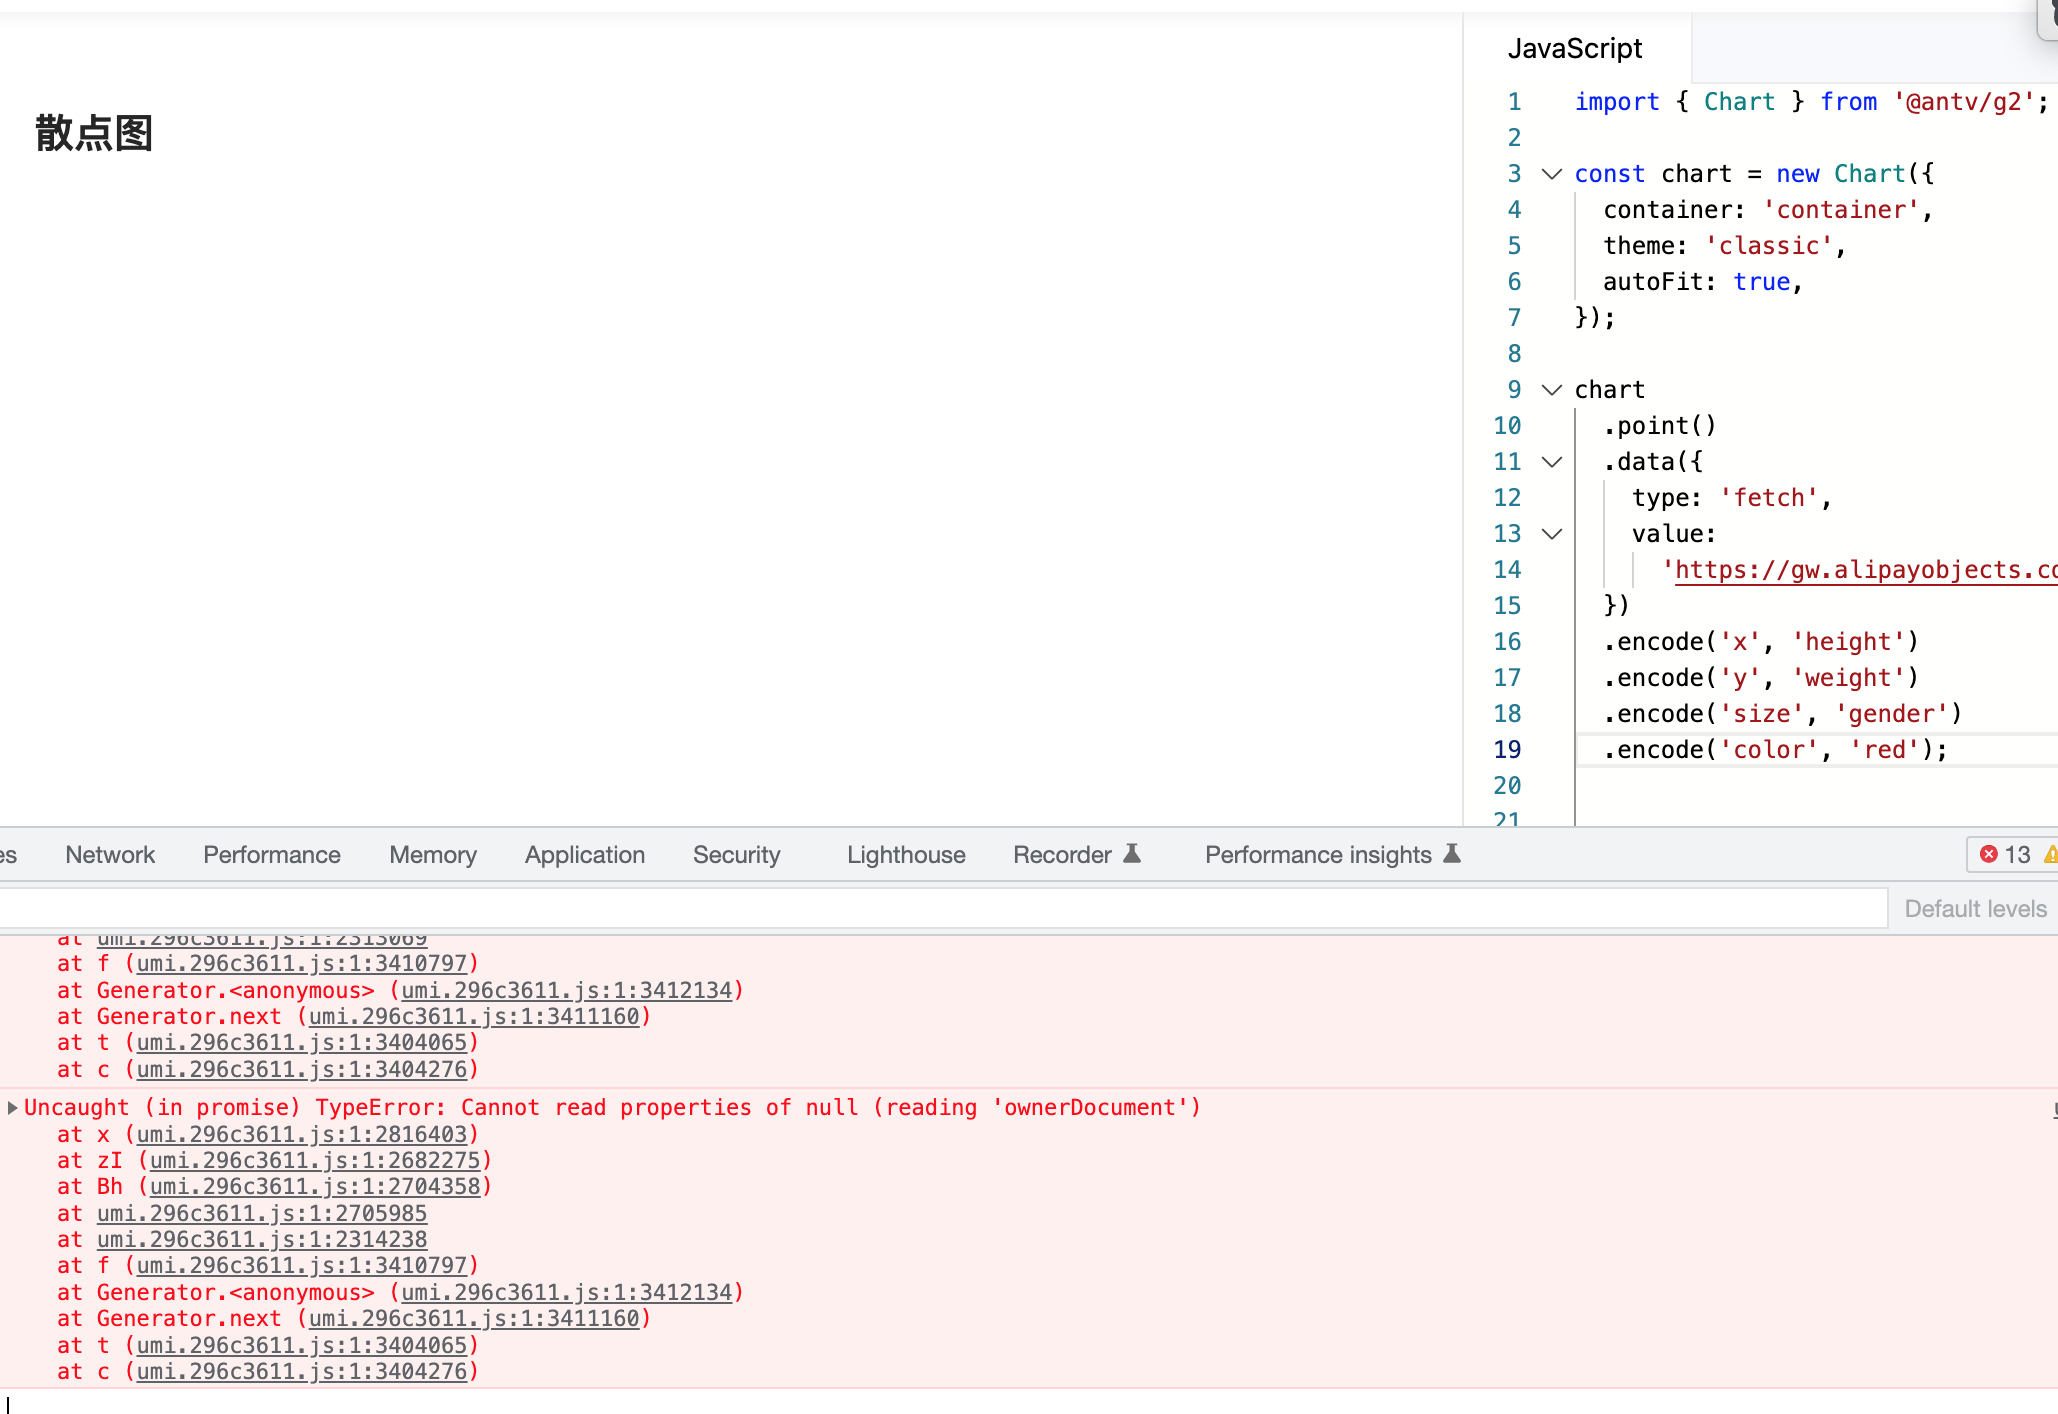
【v5】散点图 size 绑定数据时,color 设置固定颜色无法作图 #4904
Assignees


Labels
Comments
|
@Deathsteps 感谢反馈,确实命中了一个 bug,正在修复用。如果比较紧急,可以使用下面的方法绕过 bug: chart
.point()
.data({
type: 'fetch',
value:
'https://gw.alipayobjects.com/os/basement_prod/6b4aa721-b039-49b9-99d8-540b3f87d339.json',
})
.encode('x', 'height')
.encode('y', 'weight')
.encode('size', 'weight')
.style('stroke', 'red'); // 👈🏻 常量样式,可以用 style 来设置 |
import { Chart } from '@antv/g2';

const chart = new Chart({
  container: 'container',
  theme: 'classic',
  autoFit: true,
});

const data = [
  { time: '10:10', call: 4, waiting: 2, people: 2 },
  { time: '10:15', call: 2, waiting: 6, people: 3 },
  { time: '10:20', call: 13, waiting: 2, people: 5 },
  { time: '10:25', call: 9, waiting: 9, people: 1 },
  { time: '10:30', call: 5, waiting: 2, people: 3 },
  { time: '10:35', call: 8, waiting: 2, people: 1 },
  { time: '10:40', call: 13, waiting: 1, people: 2 },
];

chart.data(data);

chart
  .point()
  .encode('x', 'time')
  .encode('y', 'waiting')
  .encode('size', 'call')
  .style('stroke', 'rgba(255, 105, 0, 1)') // 这里按临时方案改了一下
  .scale('y', { independent: true })
  .axis('y', {
    position: 'right',
  });

chart
  .line()
  .encode('x', 'time')
  .encode('y', 'people')
  .encode('color', 'rgba(252, 185, 0, 1)'); // 这里也不能 encode 常量值

chart.render();
双轴图也会被影响,point 按该解决方案临时改了一下渲染有效,但追加的 line 图,encode color 又会 crash。 |
是同一个问题,最新代码这个问题已经解决了,今天会发布一个新的版本后这个图也可以正常展示了。 |
Sign up for free
to join this conversation on GitHub.
Already have an account?
Sign in to comment
问题描述
只设置 size 通道,正常

异常情况
期望结果
size 绑定数据时,color 可以设置某个固定颜色
如何重现
官方示例修改
额外信息
The text was updated successfully, but these errors were encountered: