[SoC2020] An Interactive Chart Documents in Low-Code Senario #1116
Comments
|
Hi. I am interested in this project. In my understanding, this project is to enable users to directly input configuration on webpage and see the visualization graphs. Please correct me if I'm wrong. Would you mind sharing a starting point where I can make a demo? |
|
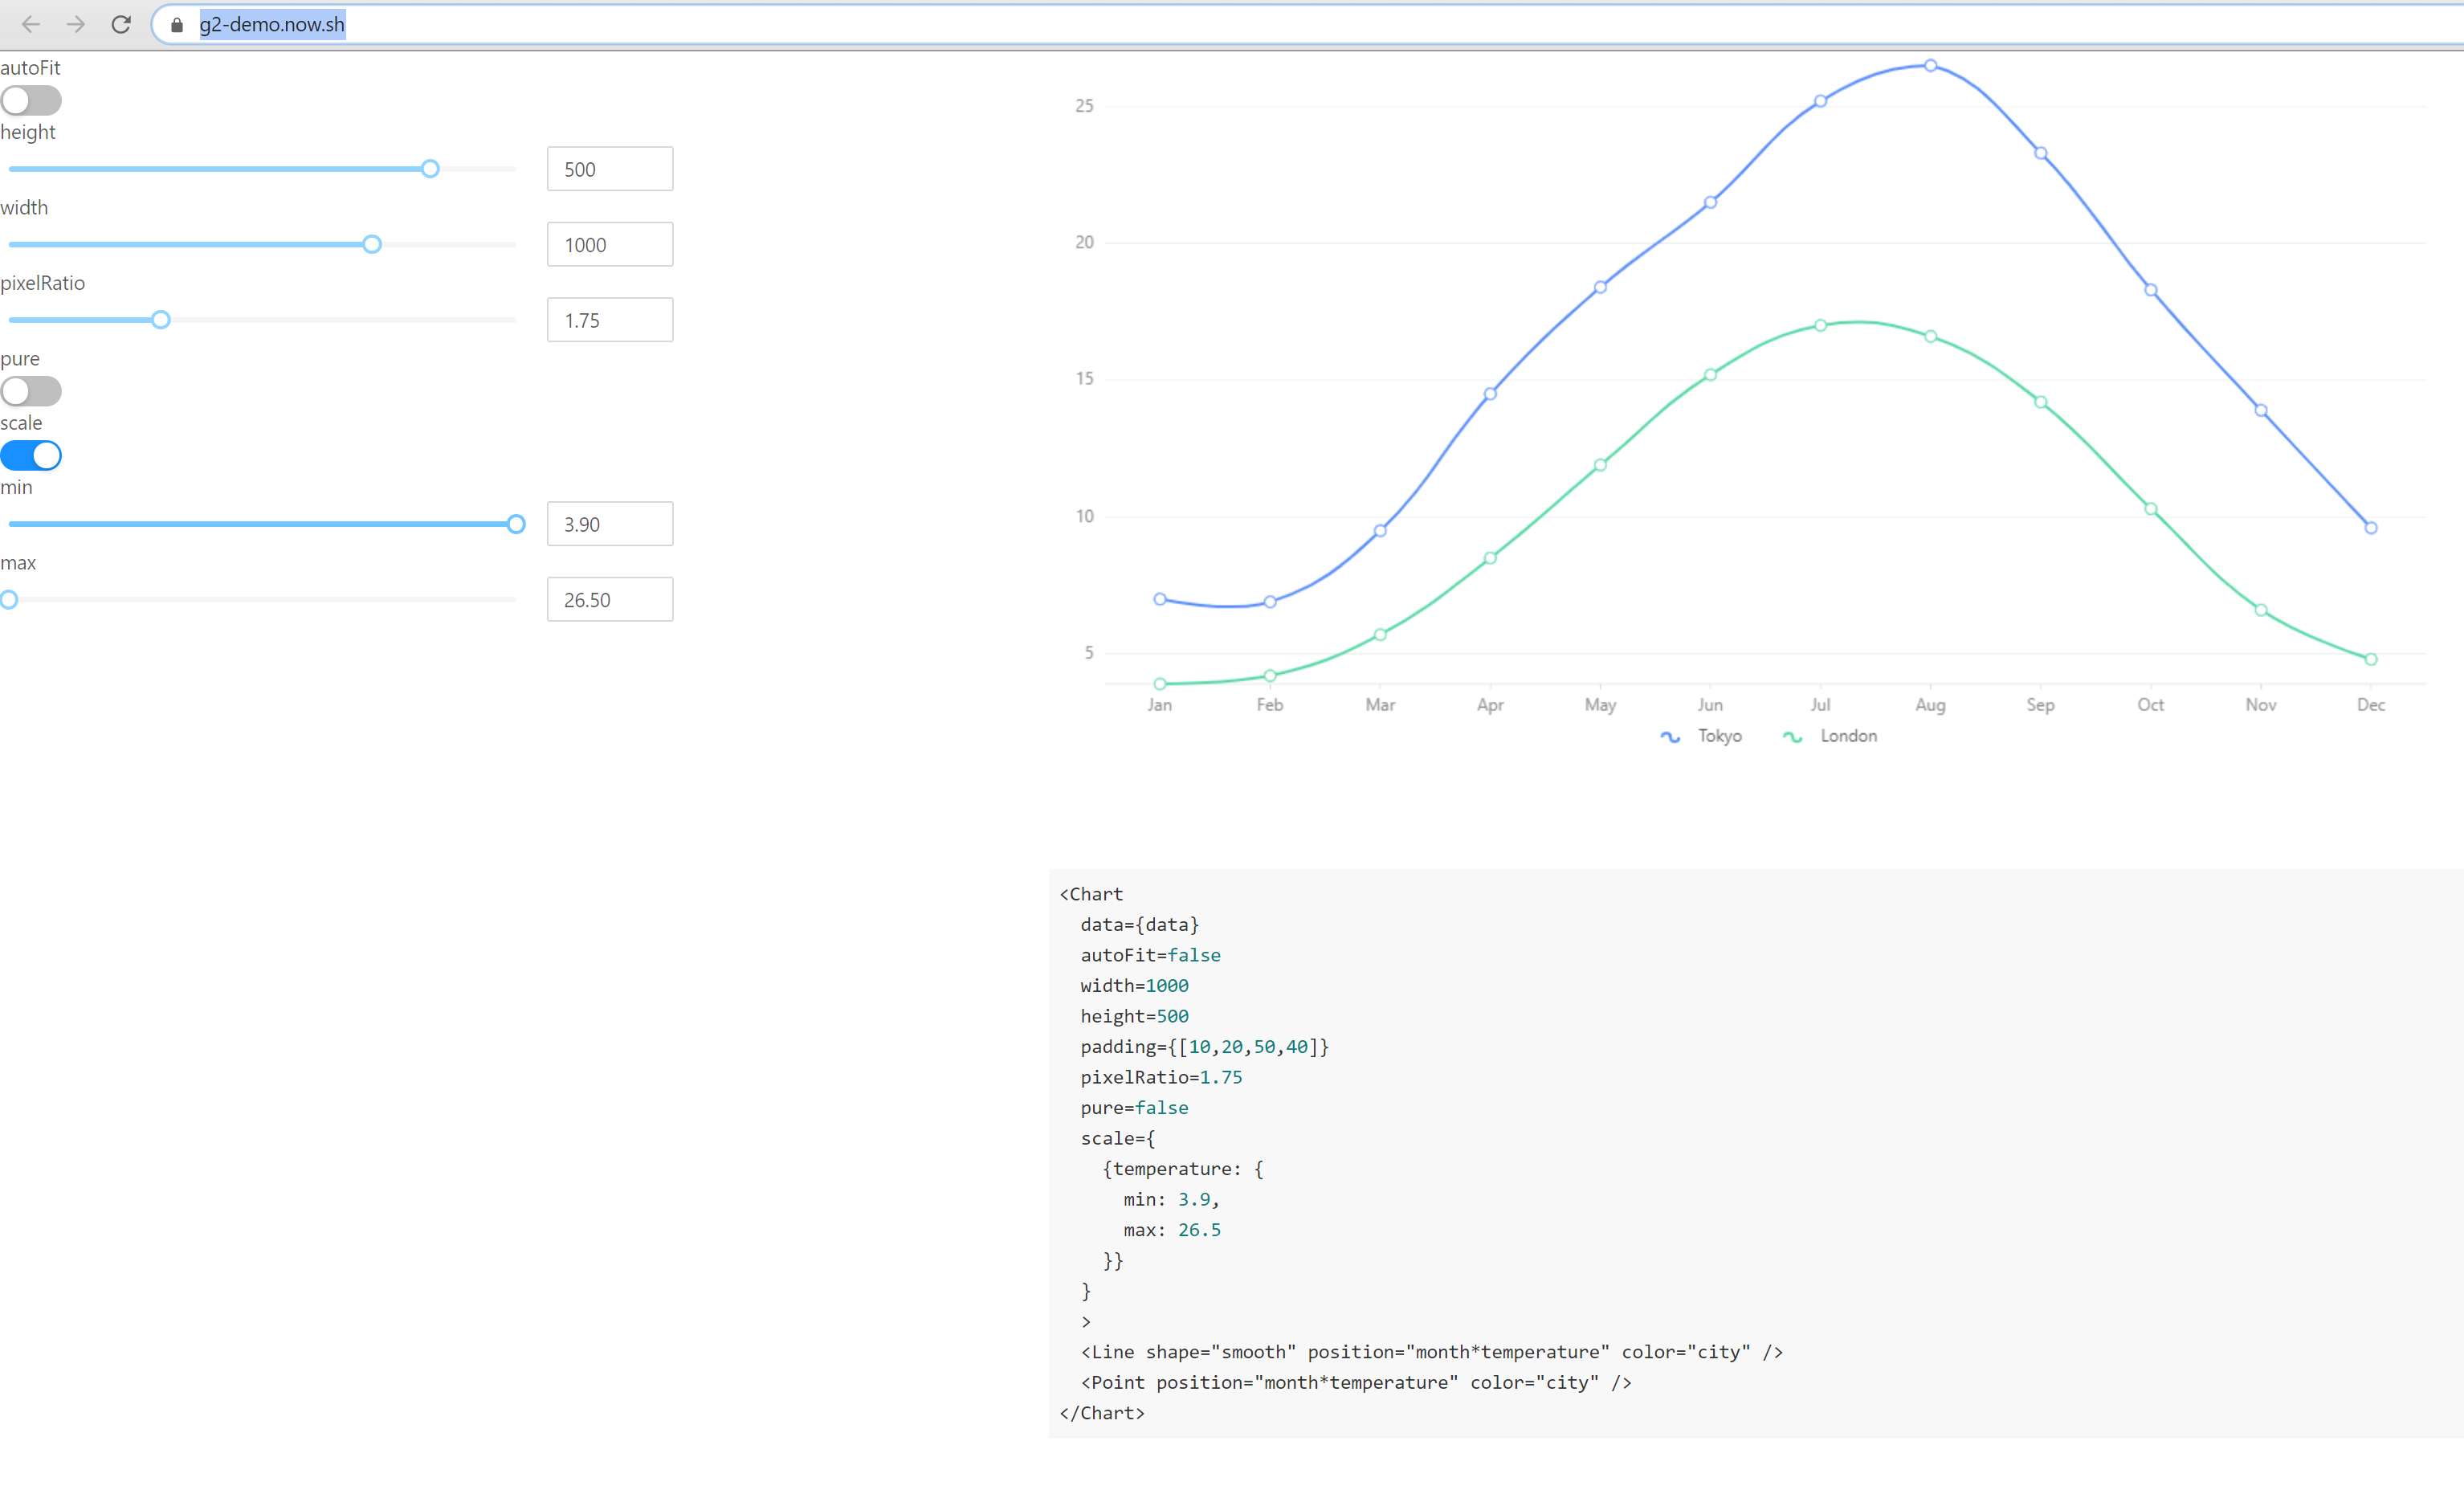
Greetings Neo @jiazhewang. I've built a simple demo here https://g2-demo.now.sh/ using this bizcharts example. Below is a screenshot of the web page. I noticed it is a g2plot project but since the requirements include React, I used bizcharts to build the prototype. I just want to check if this kind of resembles the goal of this project. I would appreciate it a lot if you could give me some suggestions and advice. Thank you very much!
|
|
Hi. Your demo is simple but the form is correct. What we want is a tool that allows users to intuitively understand the role of configs through interactive controllers. This web tool can be developed with react. However, it does not require any third-party charting library, but needs to directly use G2Plot itself. The keys of this project include:
|
|
Hi @jiazhewang, I want to work on this issue for ASoC 2020. Here’s my understanding of what needs to be done: Let's consider Line charts for example. The web tool should allow users to see how the line chart responds to changes in configuration properties such as width, height, data, color, title, description, slider, etc. in real time. Using the UI controls, users can modify the line chart according to their needs. A few questions?
|
Yes, that is expected.
The proposal should be sufficiently detailed, both in terms of content, feasibility, and time planning. You need to prove to the reviewer that your plan is in the right direction and is beneficial to our project, and that you can complete it in two full-time working hours. I think the discussion under this issue is a good example. |
|
Hi @jiazhewang, I have submitted a proposal for this project on the Alibaba Cloud website. Also, the same proposal in document format can be found here: AntV/G2Plot - ASoC 2020 Proposal. Please provide your feedback and suggestions on it. I highly value them. I have also created a Mock Wireframe Design: https://wireframepro.mockflow.com/view/g2plot-interactive-chart-document |
|
Hello @jiazhewang! Do you have any suggestions on my proposal? I had submitted the proposal well before the deadline. Can you please confirm if you have received the proposal? I am excited to begin my work with you guys and be a part of this project. Looking forward to an amazing experience. |
|
Hi @agarwalrounak , your proposal has been received. The committee is reviewing all the proposals and will let you know the results soon. |
|
Unfortunately, no one's proposal passed the committee's selection. But this issue is still of great concern to us, and we still need help and co-construction in this direction. Interested friends can continue to contact us, although not as an ASoC project, but still a good open source cooperation task. |
|
Hi @jiazhewang, I still want to work on this issue. Please guide me on how to start with this, as in, should I create a MVP first? Also, where do I commit the code as of now? Also, please provide feedback on my proposal. |
Hi @agarwalrounak , our team is re-planning this task, we will let u know once it is done. As for your proposal:
|
适用于lowcode图表搭建的交互式文档
An interactive chart documents in lowcode senario
描述 Description
G2Plot是一套致力于帮助用户以最小成本生成高质量统计图表的图表库。但G2Plot的文档形式仍然是传统的静态文档,图表演示和文档相互脱离,在使用体验上并不能真正达到“易用”和“直观”的效果,这一点也制约着依赖于G2Plot的lowcode产品平台的用户体验。
G2Plot is an interactive and responsive charting library. Based on the grammar of graphics, you can easily make superior statistical charts through a few lines of code. The document of G2Plot is still traditional static formed. The chart presentation and document are separated from each other. In pratical, it cannot really achieve the "easy to use" and "intuitive" target. This is also limited user experience of the lowcode product platform that depends on G2Plot.
目标 Goal
能够沉淀出一套交互式文档解决方案,能够服务于lowCode场景中统计图表的交互式演示及配置。使图表的组成部分、配置项能够得到更直观的理解,实现lowCode图表搭建过程的提效。
期望这套解决方案能够供多个项目独立使用,同时集成进G2Plot官方网站。
类似案例: https://nivo.rocks/area-bump/
A set of interactive document solutions of charts and can serve the interactive presentation and configuration of statistical charts in the lowCode scenario.
It is expected that this solution can be used independently for multiple projects and integrated into the official G2Plot website.
Example: https://nivo.rocks/area-bump/
需要技能 Prerequisite Skills
可视化相关科研或开发经验、React、前端 web 项目开发和架构能力。
Data Visualization relevant research or development experience, React, front-end web project development.
The text was updated successfully, but these errors were encountered: