Skip to content
New issue

Have a question about this project? Sign up for a free GitHub account to open an issue and contact its maintainers and the community.

By clicking “Sign up for GitHub”, you agree to our terms of service and privacy statement. We’ll occasionally send you account related emails.

Already on GitHub? Sign in to your account

微信小程序 tooltip展示重叠,能否自适应tooltip的高度??? #302

Closed
EleShader opened this issue Sep 3, 2018 · 13 comments · Fixed by #303
Closed

微信小程序 tooltip展示重叠,能否自适应tooltip的高度??? #302

EleShader opened this issue Sep 3, 2018 · 13 comments · Fixed by #303
Assignees
Labels
Milestone

Comments

@EleShader
Copy link

image
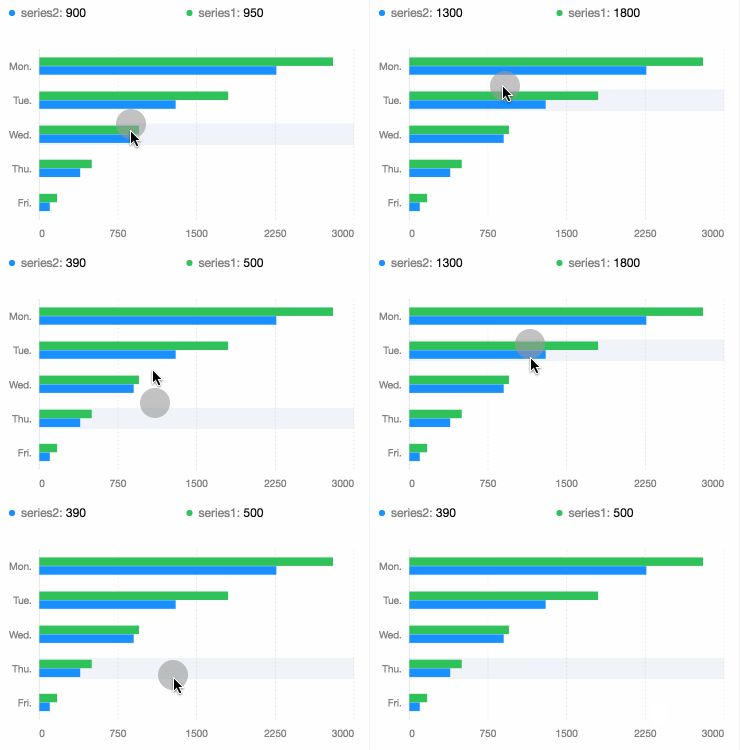
如图所示,在轴坐标字数显示比较多的情况下,会导致,title与legend重叠。能否自适应tooltip的高度。代码如下:
chart.tooltip({
showTitle: true,
offsetY: 80,
});

@EleShader
Copy link
Author

急求方法!!!!

@simaQ
Copy link
Contributor

simaQ commented Sep 3, 2018

其实这种情况,我的建议是不使用 tooltip,直接在柱子上标注文本,既能带来一目了然的表达效果,也能解决你的问题。比如:

image

@EleShader
Copy link
Author

这是我们产品经理提出的个性化需求,所有的图表上面都不能显示数字[捂脸],都必须有tooltip。你看有什么方法嘛

@simaQ
Copy link
Contributor

simaQ commented Sep 3, 2018

如果这样的话,tooltip + legend 的方式如何
default

@EleShader
Copy link
Author

这样的话,假如图表很长,一个屏幕放不下的情况下,会看不到上面的提示的。

@simaQ
Copy link
Contributor

simaQ commented Sep 3, 2018

这样吧,你把你完整的代码给,我具体看下情况。

@EleShader
Copy link
Author

data: {
datas: [],
opts: {
onInit: function initChart(canvas, width, height, datas) { // 使用 F2 绘制图表
if (datas.length > 20){
var offsetY = 260;
}else{
var offsetY = 80;
}
var legendNum = app.$window.getChartLegendNum(datas); //图例个数
let chart = new F2.Chart({
el: canvas,
width,
height
});
chart.source(datas.reverse(), {
yAxis:{
formatter: params => {
var newParamsName = ""; // 最终拼接成的字符串
var paramsNameNumber = params.length; // 实际标签的字数
var provideNumber = 10; // 每行能显示的字的个数
var rowNumber = Math.ceil(paramsNameNumber / provideNumber); // 换行的话,需要显示几行,向上取整
/**
* 判断标签的个数是否大于规定的个数, 如果大于,则进行换行处理 如果不大于,即等于或小于,就返回原标签
/
// 条件等同于rowNumber>1
if (paramsNameNumber > provideNumber) {
/
* 循环每一行,p表示行 */
for (var p = 0; p < rowNumber; p++) {
var tempStr = ""; // 表示每一次截取的字符串
var start = p * provideNumber; // 开始截取的位置
var end = start + provideNumber; // 结束截取的位置
// 此处特殊处理最后一行的索引值
if (p == rowNumber - 1) {
// 最后一次不换行
tempStr = params.substring(start, paramsNameNumber);
} else {
// 每一次拼接字符串并换行
tempStr = params.substring(start, end) + "\n";
}
newParamsName += tempStr; // 最终拼成的字符串
}
} else {
// 将旧标签的值赋给新标签
newParamsName = params;
}
//将最终的字符串返回
return newParamsName;
}
},
// xAxis:{
// tickCount: 5
// },

    });
    chart.coord({
      transposed: true
    });
    chart.tooltip({
      showTitle: true,
      offsetY: offsetY ,
    });

    chart.legend({
      align: 'center',
      position: 'bottom'
    });
    chart.axis('yAxis', {
      line: F2.Global._defaultAxis.line,
      grid: null
    });
    // chart.axis('xAxis', {
    //   line: null,
    //   grid: F2.Global._defaultAxis.grid,
    //   label: function label(text, index, total) {
    //     var textCfg = {};
    //     if (index === 0) {
    //       textCfg.textAlign = 'left';
    //     } else if (index === total - 1) {
    //       textCfg.textAlign = 'right';
    //     }
    //     return textCfg;
    //   }
    // });
    chart.axis('xAxis', {
      line: null,
      grid: F2.Global._defaultAxis.grid,
      label: function label(text, index, total) {
        if(text < 1000){
          var textCfg = {
            text: text 
          };
        }else{
        var textCfg = {
          text: text / 1000 + ' k'
        };
        }
        if (index === 0) {
          textCfg.textAlign = 'left';
        } else if (index === total - 1) {
          textCfg.textAlign = 'right';
        }
        return textCfg;
      }
    });
    var colorArray = ['#008BFF', '#4ECB73', '#77d794', '#22c7a9', '#48d7bd', '#86dcc1', '#259bfd', '#00b6fd', '#5ad0fe', '#facc14', '#dedf9f', '#e7e4a3', '#cde7c9', '#a2def6', '#5AD05E', '#0046FD', '#259BFe'];
    if (legendNum < 3){
      chart.interval().position('yAxis*xAxis').color('name', ['l(0) 0:#4ec1ff 1:#4C84FF', 'l(0) 0:#86DCC1 1:#22C7A9']).adjust({
        type: 'dodge',
        marginRatio: 0
      }).style({
        radius: 5
      }).size(10);
    }else{
      chart.interval().position('yAxis*xAxis').color('name', colorArray).adjust({
        type: 'dodge',
        marginRatio: 0
      }).style({
        radius: 5
      }).size(10);
    }
    
    chart.render();
    return chart;
  }
}

},

@simaQ
Copy link
Contributor

simaQ commented Sep 3, 2018

呀,我复现了,这个是个 BUG,tooltip 的标题折行导致的问题... 我跟进修复下

@simaQ simaQ self-assigned this Sep 3, 2018
@simaQ simaQ added the bug label Sep 3, 2018
@simaQ simaQ added this to the 3.2.2 milestone Sep 3, 2018
@EleShader
Copy link
Author

对啊,坐标轴折行展示为什么会影响tooltip中的title折行呢?希望修复下哈。谢谢啦!

@simaQ
Copy link
Contributor

simaQ commented Sep 3, 2018

更新下 F2 版本: @antv/f2@3.2.2-beta.3

@EleShader
Copy link
Author

image
你改了哪些文件,我是直接下载引入的,没有和你版本同步呀[捂脸]

@simaQ
Copy link
Contributor

simaQ commented Sep 3, 2018

亲,你更新下 f2.js 就好了呀,f2.js 可下载的地方很多,wx-f2 下的 f2.js 我已经更新了,你直接项目下 download 即可,另外建议仔细阅读README

@EleShader
Copy link
Author

嗯嗯,好的,麻烦啦哈!!!

Sign up for free to join this conversation on GitHub. Already have an account? Sign in to comment
Labels
Projects
None yet
Development

Successfully merging a pull request may close this issue.

2 participants