Skip to content
New issue

Have a question about this project? Sign up for a free GitHub account to open an issue and contact its maintainers and the community.

By clicking “Sign up for GitHub”, you agree to our terms of service and privacy statement. We’ll occasionally send you account related emails.

Already on GitHub? Sign in to your account

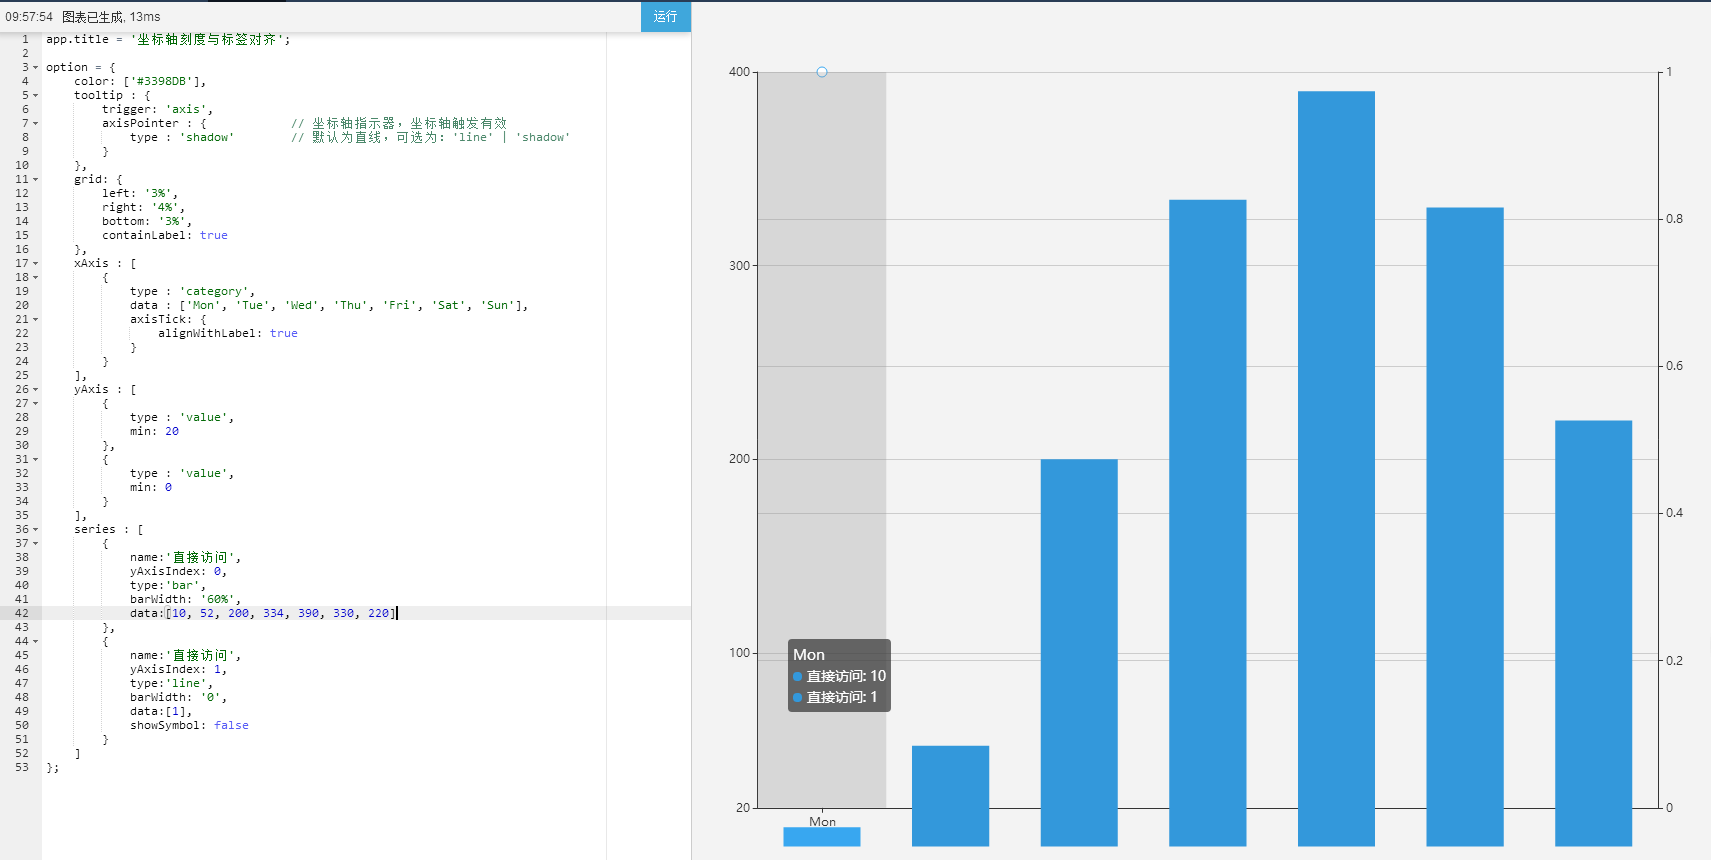
双Y轴柱状+折线图,设置yaxis的min、max后柱状图柱条下边界超越X轴 #7412

Closed
CrazyShipOne opened this issue Jan 3, 2018 · 11 comments

Comments

@CrazyShipOne
Copy link

One-line summary [问题简述]

双Y轴柱状+折线图,设置yaxis的min、max后柱状图柱条下边界超越X轴

Version & Environment [版本及环境]

  • ECharts version [ECharts 版本]: 3.7.3
  • Browser version [浏览器类型和版本]: chrome 63.0.3239.108
  • OS Version [操作系统类型和版本]: WIN10 X64

Expected behaviour [期望结果]

柱条下边界在X轴上

ECharts option [ECharts配置项]

option = {
            title: {
                text: "数量"
            },
            grid: {
                left: 60,
                top: 30,
                right: 40,
                bottom: 40
            },
            xAxis: {
                name: '',
                splitNumber: 1,
                splitLine: {lineStyle:{type:'dashed'},show:true},
                data:  ["2012年","2013年","2014年","2015年","2016年","2017年"],
                axisLabel: {
                    inside: false,
                    textStyle: {
                        color: 'black'
                    },
                    rotate: 30,
                    interval: 0
                },
                axisTick: {
                    show: true
                },
                axisLine: {
                    show: true
                },
                z: 10
            },
            legend:
                {
                    right:0,
                    data:[
                        {
                            name:'总量'
                        },
                        {
                            name:'增长率'
                        }
                    ]
                },
            yAxis:
                [
                    {
                        name: "",
                        nameTextStyle: {
                            color: 'black'
                        },
                        axisLine: {
                            show: false,
                            lineStyle: {
                                color: 'black'
                            }
                        },
                        axisTick: {
                            show: false
                        },
                        axisLabel: {
                            show: true,
                            formatter: function (value, index) {
                                if (value > 10000) {
                                    var str = (value / 10000).toString();
                                    if (str.indexOf('.') > -1) {
                                        return str.substring(0, str.indexOf(".") + 3) + '万';
                                    }
                                    return str + '万';
                                }
                                else {
                                    return 0;
                                }
                            }
                        },
                        splitLine: {lineStyle: {type: 'dashed'}, show: true},
                        min:function(value)
                        {
                            return value.min * 0.9;
                        },
                        max:function(value)
                        {
                            return value.max * 1.2;
                        }
                    },
                    {
                        name: "",
                        nameTextStyle: {
                            color: 'black'
                        },
                        axisLine: {
                            show: false,
                            lineStyle: {
                                color: 'black'
                            }
                        },
                        axisTick: {
                            show: false
                        },
                        axisLabel: {
                            show: true,
                            formatter: function (value, index) {
                                return value+'%';
                            }
                        },
                        splitLine: {lineStyle: {type: 'dashed'}, show: false},
                        min:0,
                        max:function(value)
                        {
                            return value.max*1.8;
                        }
                    }
                ],
            tooltip: {
                trigger: 'axis',
                showDelay: 0, // 显示延迟,添加显示延迟可以避免频繁切换,单位ms
                axisPointer: {            // 坐标轴指示器,坐标轴触发有效
                    type: 'shadow'        // 默认为直线,可选为:'line' | 'shadow'
                },
                formatter:function(params, ticket, callback)
                {
                    return params[0].name+'<br /><span style="display:inline-block;margin-right:5px;' +
                        'border-radius:10px;width:9px;height:9px;background-color:#75c6ff">' +
                        '</span>总数 : '+params[0].value.toLocaleString()+'吨<br/>' +
                        '<span style="display:inline-block;margin-right:5px;' +
                        'border-radius:10px;width:9px;height:9px;background-color:#6285f3"></span>'+
                        '增长率 : '+(params[1].value*1).toLocaleString()+'%';
                }
            },
            feature: {
                magicType: {
                    type: ['stack', 'tiled']
                },
                dataView: {}
            },
            series: [
                {
                    name: "总量",
                    type: 'bar',
                    barMaxWidth: 30,
                    yAxisIndex:0,
                    animationDelay: function (idx) {
                        return 10;
                    },
                    itemStyle: {
                        normal: {
                            color: '#75c6ff'
                        }
                    },
                    data: [5590986,5644154,5682473,5709709,5748763,5770601],
                    animation: true
                },
                {
                    name: "增长率",
                    type: 'line',
                    yAxisIndex:1,
                    itemStyle: {
                        normal: {
                            color: '#6285f3',
                            /*信息显示方式*/
                            label: {
                                show: false,
                                position: 'top',
                                formatter: '{c}'
                            }
                        }
                    },
                    data: [1.1496899,0.9420012,0.6743367,0.47701207,0.67934614,0.37843546],
                    animation: true
                }
            ]
        };

Other comments [其他信息]

在官网的实例上运行也出现了此问题
image

@chengwb53
Copy link

chengwb53 commented Jan 9, 2018

同求:
简单的option:

app.title = '坐标轴刻度与标签对齐';

option = {
    color: ['#3398DB'],
    tooltip : {
        trigger: 'axis',
        axisPointer : {            // 坐标轴指示器,坐标轴触发有效
            type : 'shadow'        // 默认为直线,可选为:'line' | 'shadow'
        }
    },
    grid: {
        left: '3%',
        right: '4%',
        bottom: '3%',
        containLabel: true
    },
    xAxis : [
        {
            type : 'category',
            data : ['Mon', 'Tue', 'Wed', 'Thu', 'Fri', 'Sat', 'Sun'],
            axisTick: {
                alignWithLabel: true
            }
        }
    ],
    yAxis : [
        {
            type : 'value',
            min: 20
        },
        {
            type : 'value',
            min: 0
        }
    ],
    series : [
        {
            name:'直接访问',
            yAxisIndex: 0,
            type:'bar',
            barWidth: '60%',
            data:[10, 52, 200, 334, 390, 330, 220]
        },
        {
            name:'直接访问',
            yAxisIndex: 1,
            type:'line',
            barWidth: '0',
            data:[1],
            showSymbol: false
        }
    ]
};

image

@bigfacewo
Copy link

bigfacewo commented Jan 17, 2018

我也遇到这个问题了,而且是单Y轴的情况,设置成dataMin也不行,从3.4版本切换到3.8.4之后出现的,试了下4.0.1也有这个问题

@bigfacewo
Copy link

@pissang

@bigfacewo
Copy link

请问这个问题有什么进展吗?

@sunlandong
Copy link

+1

@100pah
Copy link
Member

100pah commented Mar 6, 2018

加一个 onZero 就可以了。不过这个事情应该优化下。

option: {
    ...,
    xAxis: {
        ...,
        axisLine: {
            onZero: false,
            show: true
        }
    },
    ...
}

@bigfacewo
Copy link

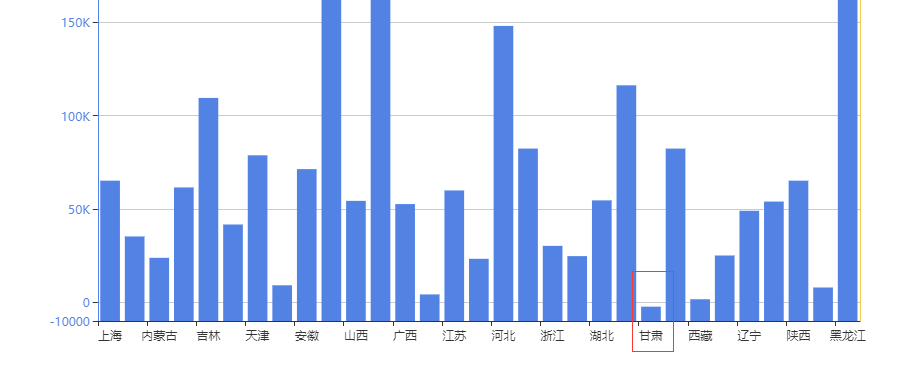
onZero似乎不能解决这个问题,只是坐标轴下移了,但是当数据含有负值,原本的坐标轴方向是向下的,现在变成全部向上了。@100pah
image

image

@100pah 100pah closed this as completed in 1da2473 Mar 8, 2018
@bigfacewo
Copy link

这个问题仍然没有解决。

@peacejj
Copy link

peacejj commented Jul 10, 2018

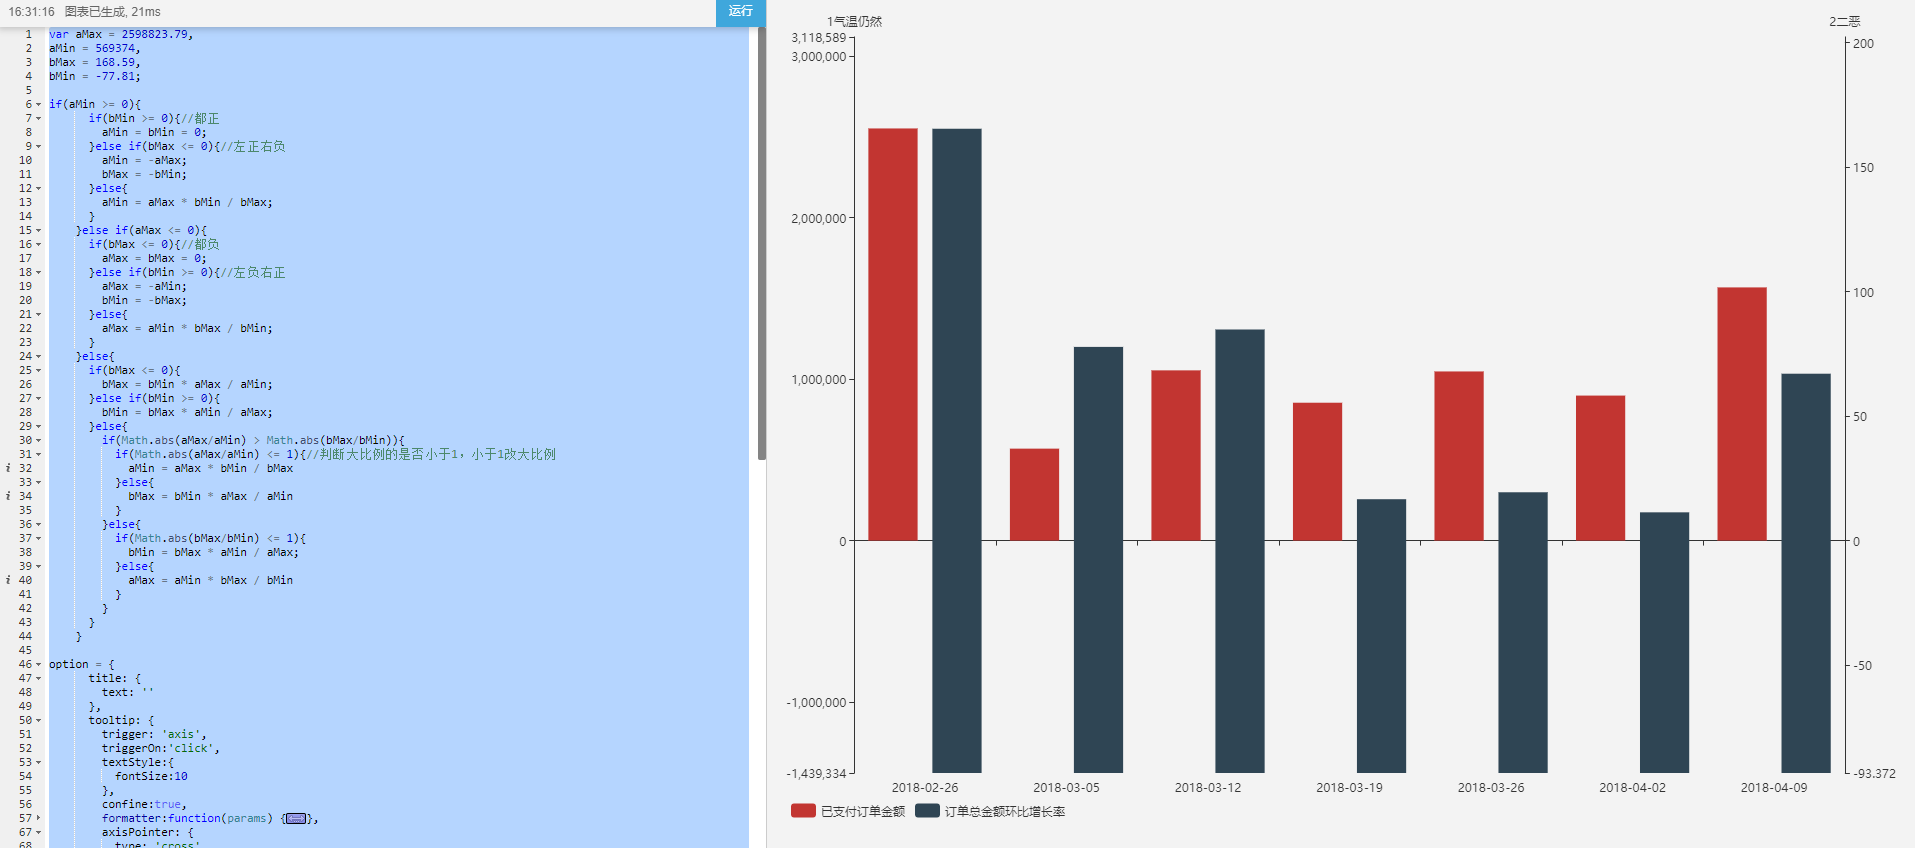
下面这种情况第一个y轴从0开始,第二个是从最底层开始,有误

var aMax = 2598823.79,
aMin = 569374,
bMax = 168.59,
bMin = -77.81;

if(aMin >= 0){
      if(bMin >= 0){//都正
        aMin = bMin = 0;
      }else if(bMax <= 0){//左正右负
        aMin = -aMax;
        bMax = -bMin;
      }else{
        aMin = aMax * bMin / bMax;
      }
    }else if(aMax <= 0){
      if(bMax <= 0){//都负
        aMax = bMax = 0;
      }else if(bMin >= 0){//左负右正
        aMax = -aMin;
        bMin = -bMax;
      }else{
        aMax = aMin * bMax / bMin;
      }
    }else{
      if(bMax <= 0){
        bMax = bMin * aMax / aMin;
      }else if(bMin >= 0){
        bMin = bMax * aMin / aMax;
      }else{
        if(Math.abs(aMax/aMin) > Math.abs(bMax/bMin)){
          if(Math.abs(aMax/aMin) <= 1){//判断大比例的是否小于1,小于1改大比例
            aMin = aMax * bMin / bMax
          }else{
            bMax = bMin * aMax / aMin
          }
        }else{
          if(Math.abs(bMax/bMin) <= 1){
            bMin = bMax * aMin / aMax;
          }else{
            aMax = aMin * bMax / bMin
          }
        }
      }
    }
    
option = {
      title: {
        text: ''
      },
      tooltip: {
        trigger: 'axis',
        triggerOn:'click',
        textStyle:{
          fontSize:10
        },
        confine:true,
        formatter:function(params) {
          let relVal = params[0].name;
          for (let i = 0, l = params.length; i < l; i++) {
            relVal += '<br/>' + params[i].marker + params[i].seriesName + ' : ' + params[i].value;
            if(params[i].seriesName.match(RegExp(//))){
              relVal += "%"
            }
          }
          return relVal;
        },
        axisPointer: {
          type: 'cross',
          label: {
            precision:2,
          },
          crossStyle: {
            color: '#999'
          }
        }
      },
      grid: {
        left:'10',
        right:'10',
        containLabel:true,
        bottom: '40',
        top:'30'
      },
      legend: {
        bottom:'10',
        left:'10',
        right:'10',
        type:'scroll'
      },
      dataZoom : [{
        show: false,
        start: 0,
        end: 100,
      }, {
        type: 'inside',
        start: 94,
        end: 100
      }],
      xAxis: [
        {
          type: 'category',
          data: ["2018-02-26", "2018-03-05", "2018-03-12", "2018-03-19", "2018-03-26", "2018-04-02", "2018-04-09"],
          axisLabel: {
            formatter: function (name) {
              return (name.length > 10 ? (name.slice(0,10)+"...") : name );
            },
          }
        }
      ],
      yAxis: [
        {
          type: 'value',
          max:(aMax*1.2).toFixed(0),
          min:(aMin*1.2).toFixed(0),
          name: '1气温仍然',
          splitLine:{show:false},
          nameGap:10
        },
        {
          type: 'value',
          max:(bMax*1.2).toFixed(4),
          min:(bMin*1.2).toFixed(4),
          name: '2二恶',
          splitLine:{show:false},
          axisLine : {onZero: true,onZeroAxisIndex:0},
          nameGap:10
        }
      ],
      series: [
                {name: "已支付订单金额", data: ["2552275.09", "569374.41", "1054162.30", "853733.58", "1047437.88", "897950.59", "1567854.86"], type: "bar", yAxisIndex: 0},
                 {name: "订单总金额环比增长率", data: ["165.45", "77.81", "84.80", "16.62", "19.41", "11.35", "67.04"], type: "bar", yAxisIndex: 1},

            ]
    };

qq 20180710163333

@zhans1099
Copy link

想了零时解决办法
添加辅助条
1、辅助条的数字和 yMin 值一样
2、对应的data 的 value值也要相应的减去 ymin 的值

app.title = '堆叠柱状图';
option = {
tooltip : {
trigger: 'axis',
axisPointer : { // 坐标轴指示器,坐标轴触发有效
type : 'shadow' // 默认为直线,可选为:'line' | 'shadow'
}
},
legend: {
data: ["汽温", "壁温", "氧化", "超温"],
bottom: 1
},
grid: {
left: '3%',
right: '4%',
bottom: '3%',
containLabel: true
},
xAxis : [
{
type : 'category',
data : ["1.1", "1.2", "1.3", "1.4", "1.5", "1.6", "1.7"]
}
],
yAxis : [
{
min: function(){return 450},
max: function(){return 500},
type : 'value'
}
],
series : [
{
name: '辅助',
type: 'bar',
stack: '广告',
itemStyle: {
normal: {
barBorderColor: 'rgba(0,0,0,0)',
color: 'rgba(0,0,0,0)'
},
emphasis: {
barBorderColor: 'rgba(0,0,0,0)',
color: 'rgba(0,0,0,0)'
}
},
data: [450, 450, 450, 450, 450, 450, 450]
},
{
name:'应收',
type:'bar',
data:[450, 450, 453, 450, 450, 450, 450]
},
{
name:'电视',
type:'bar',
stack: '广告',
data:[10, 20, 30, "-", "-", 40, "-"]
},
{
name:'手机',
type:'bar',
stack: '广告',
data:["-", "-", "-", "-", 50, "-", "-"]
},
{
name:'网页',
type:'bar',
stack: '广告',
data:["-", "-", "-", 0, "-", "-", 0]
}
]
};

@cooljser
Copy link

cooljser commented Dec 3, 2021

I have met the same problem.
Echarts Version:4.9.0

Sign up for free to join this conversation on GitHub. Already have an account? Sign in to comment
Projects
None yet
Development

No branches or pull requests

8 participants