Skip to content
New issue

Have a question about this project? Sign up for a free GitHub account to open an issue and contact its maintainers and the community.

By clicking “Sign up for GitHub”, you agree to our terms of service and privacy statement. We’ll occasionally send you account related emails.

Already on GitHub? Sign in to your account

How to hide Null values showing in tooltip for ECharts? #9763

Closed
KoushikV-Hexaware opened this issue Jan 16, 2019 · 5 comments
Closed

How to hide Null values showing in tooltip for ECharts? #9763

KoushikV-Hexaware opened this issue Jan 16, 2019 · 5 comments

Comments

@KoushikV-Hexaware
Copy link

How to hide Null values showing in tool-tip for E Charts:

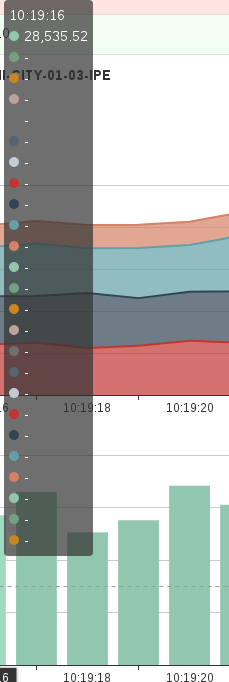
   -> In my case E chart showing  tooltip having null values which I need to avoid those null values 

showing in tooltip .Pls help on how to hide those null values in ECharts(tooltip).

@deqingli
Copy link
Member

Hi @KoushikV-Hexaware, please provide an detailed message. such as an demo, for us to debug.

@ihakh
Copy link

ihakh commented Apr 6, 2020

image
like this one
this is a stacked bar chart with data only for one of the series
I add to the dataset through a SSE(Server Sent Events) and since I don't know how many item is there so I have maximum series possible.
but the null value is shown in the tooltip

@ihakh
Copy link

ihakh commented Apr 6, 2020

this code solved the issue for me:

tooltip: {
    trigger: 'axis',
    axisPointer: {
        type: 'cross',
    },
    formatter: function(params) {
        output = '<b>' + params[0].name + '</b><br/>'
        for (i = 0; i < params.length; i++) {
            dim = params[i].dimensionNames[params[i].encode.y[0]]
            if (dim in params[i].value){
                output += params[i].marker + params[i].seriesName + ': ' + params[i].value[dim];
                if (i != params.length - 1) { // Append a <br/> tag if not last in loop
                    output += '<br/>'
                }
            }
        }
        return output
    }
}

@Christophe31
Copy link

Chart.js have a filter function for tooltips.
Maybe this can be a good option ( https://www.chartjs.org/docs/latest/configuration/tooltip.html#filter-callback )
It would allow to hide values under a given proportion/0/null to reduce it's perceived weight for graphs with too many series…

@winsmith
Copy link

Updated @ihakh's answer for 2023:

      formatter: function (params) {
        var output = params[0].axisValueLabel + '<br/>';
        console.log(params);

        output += '<table class="w-full">';

        params.reverse().forEach(function (param) {
          const value = param.data[param.seriesIndex];
          if (value !== 0) {
            output += `<tr>
              <td>${param.marker}</td>
              <td>${param.seriesName}</td>
              <td class="text-right font-bold tabular-nums">${value}</td>
            </tr>`;
          }
        });

        return output + '</table>';
      },

Thanks a lot Ihakh!

Sign up for free to join this conversation on GitHub. Already have an account? Sign in to comment
Labels
None yet
Projects
None yet
Development

No branches or pull requests

6 participants