dataZoom for the clustered charts #12871
Comments
|
This issue is not created using issue template so I'm going to close it. 🙊 If you think you have already made your point clear without the template, or your problem cannot be covered by it, you may re-open this issue again. 这个 issue 未使用 issue 模板 创建,所以我将关闭此 issue。 如果你认为虽然没有使用模板,但你已经提供了复现问题的充分描述,或者你的问题无法使用模板表达,也可以重新 open 这个 issue。 |
Sign up for free
to join this conversation on GitHub.
Already have an account?
Sign in to comment
Hi,
There seems to be a limitation on how dataZoom draws the timeline for the clustered charts.
Consider following example. Clustered bar chart with the categorical legend.
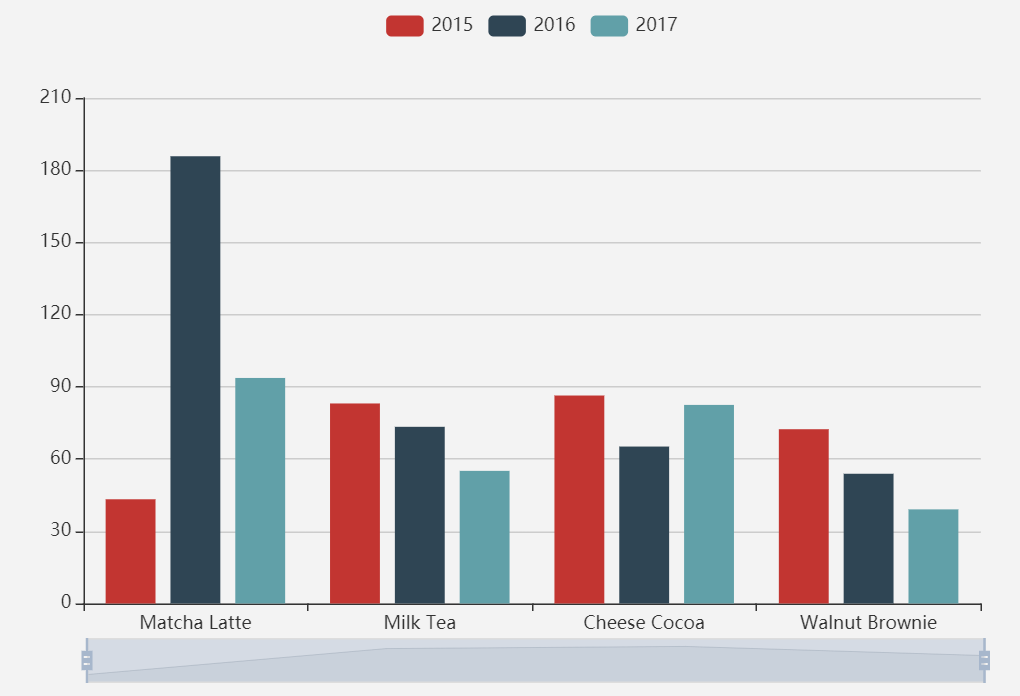
As you can see from the image, "Matcha Latte" has a significant peak on the 2016. However, dataZoom does not correctly indicate this. It seems that dataZoom always draws timeline for the first category which is "2015" in the example above. Instead as a user I would expect that dataZoom displays timeline across the total of the categorical values. It should also respond correctly based on the categories selected/highlighted.
I did not come across any configuration option to support above. Could you please advise?
Here is the example:
option = {
legend: {},
tooltip: {},
dataset: {
source: [
['product', '2015', '2016', '2017'],
['Matcha Latte', 43.3, 185.8, 93.7],
['Milk Tea', 83.1, 73.4, 55.1],
['Cheese Cocoa', 86.4, 65.2, 82.5],
['Walnut Brownie', 72.4, 53.9, 39.1]
]
},
xAxis: {type: 'category'},
yAxis: {},
// Declare several bar series, each will be mapped
// to a column of dataset.source by default.
dataZoom: [
{
show: true,
type: 'slider',
start: 0,
end: 100,
filterMode: 'filter'
},
{
type: 'inside',
start: 0,
end: 100
},
{
show: false,
yAxisIndex: 0,
filterMode: 'empty',
width: 30,
height: '80%',
showDataShadow: false,
left: '93%'
}
],
series: [
{type: 'bar'},
{type: 'bar'},
{type: 'bar'}
]
};
Thanks in advance,
Dee
The text was updated successfully, but these errors were encountered: