Skip to content
New issue

Have a question about this project? Sign up for a free GitHub account to open an issue and contact its maintainers and the community.

By clicking “Sign up for GitHub”, you agree to our terms of service and privacy statement. We’ll occasionally send you account related emails.

Already on GitHub? Sign in to your account

3D绘制surface曲面中的问题 #8319

Closed
waitkafuka opened this issue May 10, 2018 · 12 comments
Closed

3D绘制surface曲面中的问题 #8319

waitkafuka opened this issue May 10, 2018 · 12 comments
Labels
stale Inactive for a long time. Will be closed in 7 days.

Comments

@waitkafuka
Copy link

waitkafuka commented May 10, 2018

3D surface图表中的数据坐标,有什么要求吗?按理说不是应该空间中任意三个不重合的点都可以绘制出一个面吗?为什么在实际中绘制不了呢?
代码:

    var myChart = echarts.init(document.getElementsByClassName('chart-container')[0]);
    var data = [
        [-1, -1, 0],
        [0, -1, 0],
        [0.5, -1, 0]
    ];
    var option = {
        grid3D: {
        },
        xAxis3D: {
        },
        yAxis3D: {
        },
        zAxis3D: {
        },
        series: [{
            type: 'surface',
            data:data
        }]
    }
    myChart.setOption(option);

实际上是想做一个类似这样的图:
image
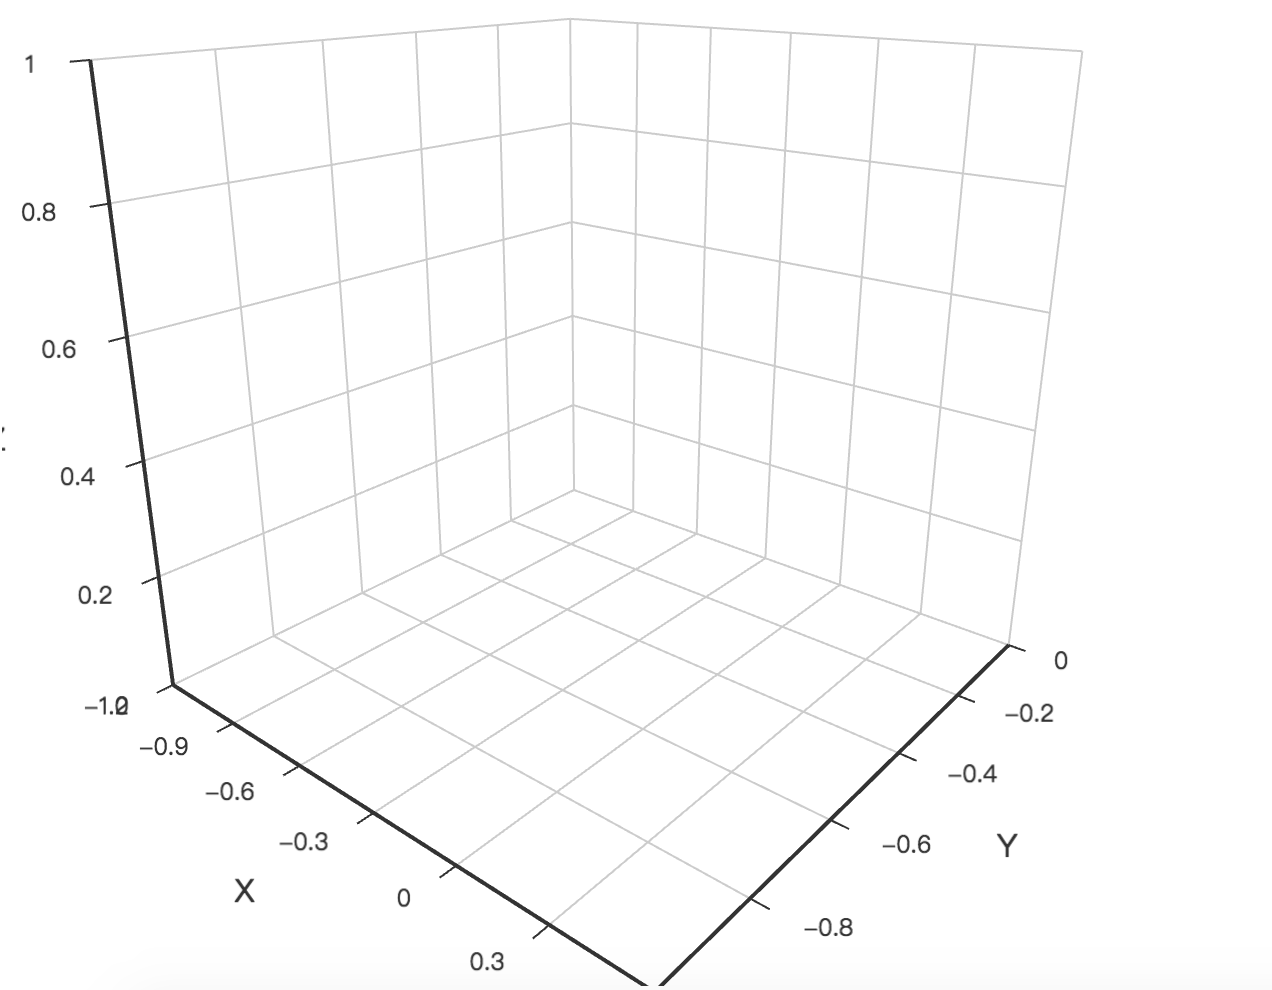
但是用上面三个数据点的代码,把数据放进去,渲染不出来,是一片空白:
image
求解!
是对data有什么要求?

@waitkafuka
Copy link
Author

把里面的data换一下,换成这种:

var data = [
        [-1, -1, 0],
        [-0.5, -1, 0],
        [0, -1, 0],
        [0.5, -1, 0],
        [1, -1, 0],
        [-1, -0.5, 0],
        [-0.5, -0.5, 1],
        [0, -0.5, 0],
        [0.5, -0.5, -1],
        [0, 0, 0],
        [0.5, 0, 0],
        [1, 0, 0],
        [1, 0.5, 0]
    ];

就能出来图形:
image
这是为什么?难道是点不够?

@weenhall
Copy link

这个问题解决了吗,兄台

@harsima
Copy link

harsima commented Jul 8, 2019

和顺序有关,先做X轴一排数据(Y轴不变),然后再逐次向上加Y轴

@EmptyHead35
Copy link

和顺序有关,先做X轴一排数据(Y轴不变),然后再逐次向上加Y轴

那怎么做垂直x轴平行y轴的平面,我输入了这个 data:[[0,0,0],[0,1,0],[0,0,1],[0,1,1]],然后出不来图

@hanwenbo
Copy link

hanwenbo commented Sep 4, 2019

@EmptyHead35 怎么排序 分享下

@EmptyHead35
Copy link

EmptyHead35 commented Sep 4, 2019

@EmptyHead35 怎么排序 分享下


这个上面写了排序的规则。我自己做了几个平面,

option = {
    tooltip: {},
    backgroundColor: '#fff',
    visualMap: {
        show: false,
        dimension: 2,
        min: -1,
        max: 1,
        inRange: {
            color: ['#313695', '#4575b4', '#74add1', '#abd9e9', '#e0f3f8', '#ffffbf', '#fee090', '#fdae61', '#f46d43', '#d73027', '#a50026']
        }
    },
    xAxis3D: {
        type: 'value'
    },
    yAxis3D: {
        type: 'value'
    },
    zAxis3D: {
        type: 'value'
    },
    grid3D: {
        viewControl: {
            // projection: 'orthographic'
        }
    },
    series: [{
        type: 'surface',
        wireframe: {
            // show: false
        },
        //这个垂直z轴是x,y面
         data:[[0,0,0],[1,0,0],[0,1,0],[1,1,0]]
    },{
        type: 'surface',
        wireframe: {
            // show: false
        },
        //这垂直y个是x,z面
         data:[[0,0,0],[1,0,0],[0,0,1],[1,0,1]]
    },{
        type: 'surface',
        wireframe: {
            // show: false
        },
        //这垂直x个是y,z面,但是这个面画不出来
         data:[[0,0,0],[0,1,0],[0,0,1],[0,1,1]]
    }
    ,{
        type: 'surface',
        wireframe: {
            // show: false
        },
        parametric:true,
        //这垂直x个是y,z面,用参数方程画出来
          parametricEquation: {
    u: {
        min:0,
        max: 1,
        step: 1
    },
    v: {
         min:0,
        max: 1,
        step: 1
    },
    x: function (u, v) {
        return 0;
    },
    y: function (u, v) {
        return u;
    },
    z: function (u, v) {
        return  v
    }
         }
    }


]
}

@EmptyHead35
Copy link

@hanwenbo
Copy link

hanwenbo commented Sep 4, 2019

@EmptyHead35 我想根据三维的散点坐标画出来曲面图 您有思路么

@EmptyHead35
Copy link

@EmptyHead35 我想根据三维的散点坐标画出来曲面图 您有思路么

你可以私聊我,或者用QQ交流。。。你要所有散点都有了,就是用data,而不是用方程了。

@github-actions
Copy link
Contributor

This issue has been automatically marked as stale because it did not have recent activity. It will be closed in 7 days if no further activity occurs. If you wish not to mark it as stale, please leave a comment in this issue.

@github-actions github-actions bot added the stale Inactive for a long time. Will be closed in 7 days. label Sep 10, 2021
@github-actions
Copy link
Contributor

This issue has been automatically closed because it did not have recent activity. If this remains to be a problem with the latest version of Apache ECharts, please open a new issue and link this to it. Thanks!

@nba20416
Copy link

所有散点都有了,就是用data,而不是用方程

您好,我也有这个问题,我有三维的点,但是出不来曲面图是空白。不知道怎么处理Z轴的数据。

Sign up for free to join this conversation on GitHub. Already have an account? Sign in to comment
Labels
stale Inactive for a long time. Will be closed in 7 days.
Projects
None yet
Development

No branches or pull requests

6 participants