Be able to set Y-axis range #2098
Comments
|
Notice: this issue has been closed because it has been inactive for 444 days. Feel free to comment and request for this issue to be reopened. |
|
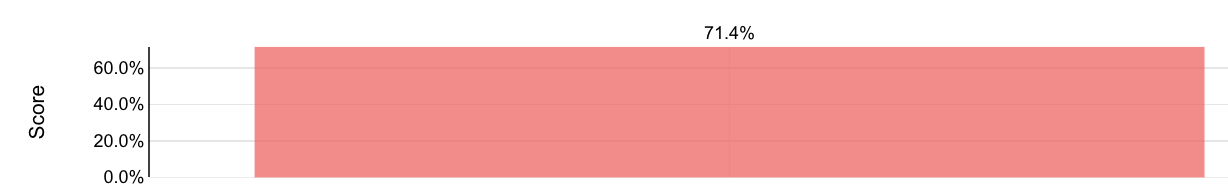
Hi, was this feature ever implemented? I can't find a way to set default limits for the y-axis on bar charts. In the image below, I want the y-axis limits to be from 0-100%. Example of issue:
|
|
Solve this??? |
|
scratch my previous comment. i dont think this request was implemented yet. |
|
+1. Without being able to set y-axis to 0-100%, the resulting charts are always misleading! |
|
hi Cate, |

9 tasks
Sign up for free
to join this conversation on GitHub.
Already have an account?
Sign in to comment
Make sure these boxes are checked before submitting your issue - thank you!
Expected results
When creating a line graph, specially percentage based, being able to set a fixed y axis to a value, i.e. 0% - 100% instead of the axis automatically setting it to the highest value
Actual results
Y axis is always the max value for the graph
Steps to reproduce
Create a line graph, assign percentage values, Y axis will be set to the max value data point
The text was updated successfully, but these errors were encountered: