Generation of automatic result (pass/warning/fail) based on defined performance acceptance criteria #5321
Comments
|
piotr.mirek (migrated from Bugzilla): |
|
piotr.mirek (migrated from Bugzilla): |

|
piotr.mirek (migrated from Bugzilla): |

|
piotr.mirek (migrated from Bugzilla): |
|
piotr.mirek (migrated from Bugzilla): |

|
piotr.mirek (migrated from Bugzilla): Current JMeter dashboard report is informative only, requested changes are to make it more like decision maker and use it more easily within CI/CD pipelines and cloud integrations. |
|
piotr.mirek (migrated from Bugzilla): |

|
piotr.mirek (migrated from Bugzilla): E.g. PAC config element assigned for thread group (or simple controller, etc):
In this way you will reduce assigning multiple PACs with same requirements for whole group. |
piotr.mirek (Bug 64457):
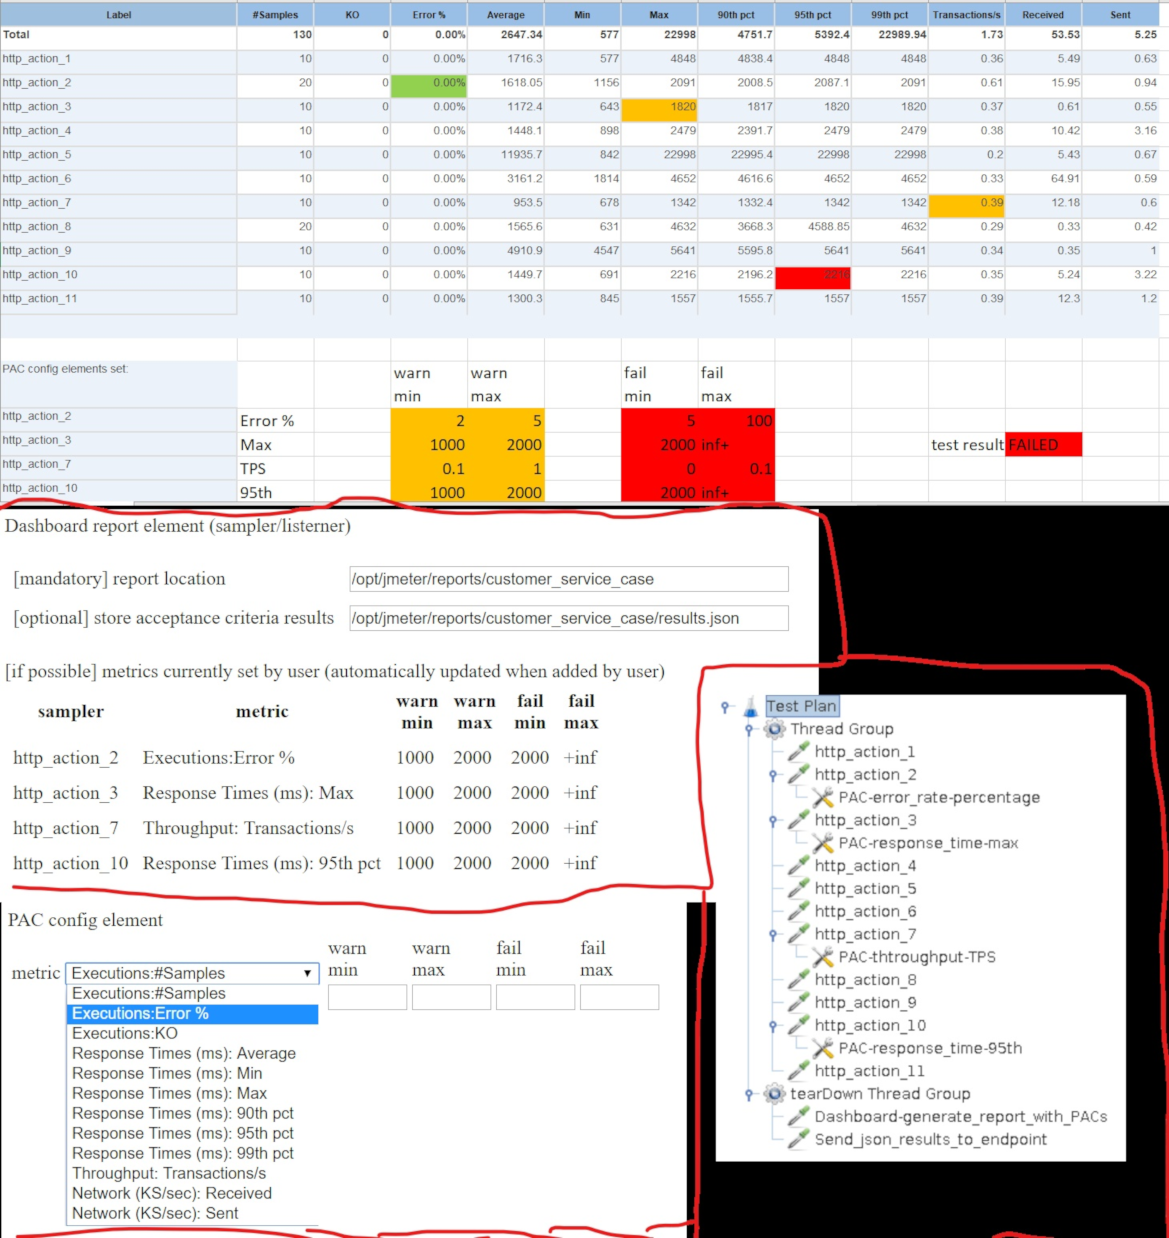
TEST RESULT (PASS/WARNING/FAIL) EVALUATION
Currently Dashboard provides very nice report, though I find it lacks important features to get clear result if test is passed or not.
There should be possibility to set this based on performance SLAs/requirements by user to evaluate this easily. Some examples:
Definition of failed condition in this case is a must, and warning is beneficial to rise attention that problem may be close.
TEST RESULT DEFINITION
This should reflect Dashboard statistics with relevant colors (please see attachment) via using CSS classes for errors/warnings/failures
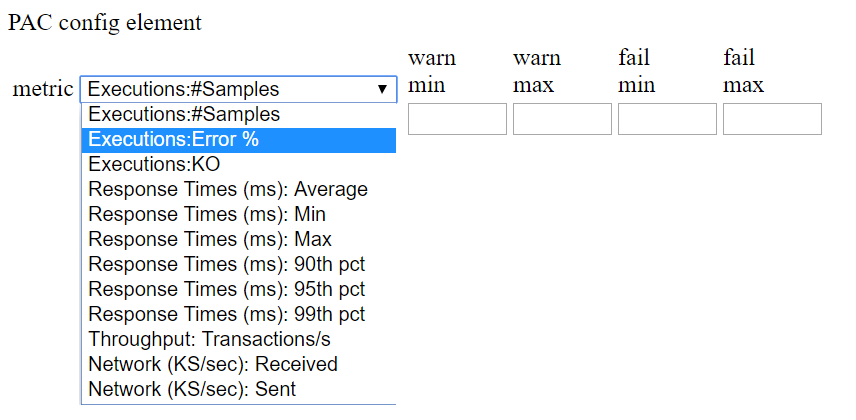
PAC CONFIG ELEMENT
To get this, there should be possibility to have config element - let's call it for a now PAC - performance acceptance criteria, that can be added to each sampler.
PAC should have possibility to optional set ranges for pass/warning/fail criteria for each value that can be seed in the dashboard main statistics, e.g.
Executions
Response Times (ms)
Throughput
Network (KS/sec)
Please see PAC element prototype for better overview in attachments
TEST DASHBOARD/RESULTS ELEMENT
It should be possible to add test dashboard as element in test plan, for having it visualized together with PAC config elements in same plan (attachments).
If possible, dashboard element should update new PAC config elements data on-the-fly. (please see the attachment)
Evaluation result should be also provided in JSON format, as a file that can be easily integrated in CI/CD pipelines (parsing json is "cheaper" than XML and .json files can be easily send via curl to many endpoints)
Please see test plan example in the attachements
OS: All
Duplicates:
The text was updated successfully, but these errors were encountered: