Make aggregation not mandatory #5570
Comments
|
I too would like this change. It would also be nice to change the legend for your metric under "Custom SQL" to rename it. Instead of AVG(metric) you could do AVG(metric) AS [my_legend_name] |
|
This is more complex than it may seem. The assumption that a metric is an aggregate function runs deep in Superset. The clear and easy workaround is to use a dummy aggregation function. min, max, sum should all provide the same answer in cases where dimension combinations are unique in the source data. The downside is a bit more work on the database side. Note that in some cases that can hurt quite a bit. For example for geospatial data visualizations where hundreds of thousands of data points can be surfaced, grouping by lat&long is expensive and often unnecessary. The committers have had lengthy conversations about this, and the key may be something around the I don't see this work getting prioritized anytime soon though as the work would be complex and there are clear easy workarounds. |
|
@mistercrunch I have been using AVG or SUM as my dummy aggregations. However now in the legend it shows something like AVG(metric) as my metric name. Which is a little misleading. Any chance to to change this in the "Custom SQL" section or elsewhere. Something like AVG(metric) AS [my_legend_name] Ex: AVG(price) AS [Price (CAD$)]. Legend will now show "Price CAD$" instead of AVG(price). |
|
@mistercrunch thank you for your information, I also believe that should be discussed already but couldn't find the issue on GitHub. |
|
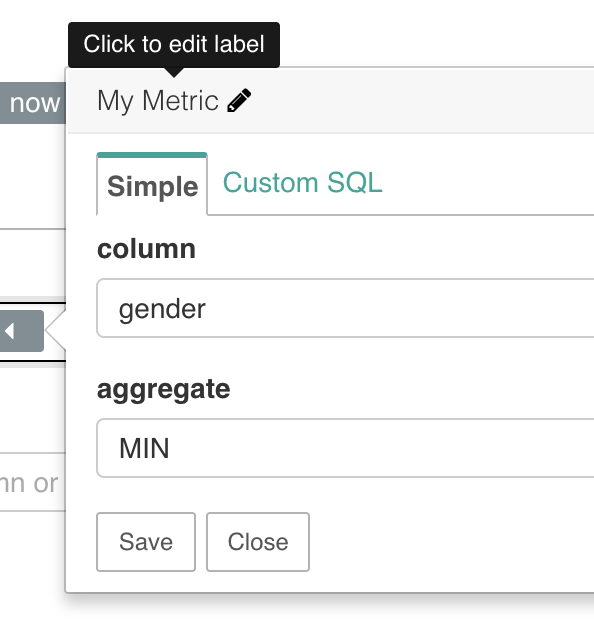
You should be able to click and edit the label of the metric, and that should show up in the legend. |
|
@mistercrunch greatest feature ever! Thank you for pointing this out. |
|
This issue has been automatically marked as stale because it has not had recent activity. It will be closed if no further activity occurs. Thank you for your contributions. For admin, please label this issue |
|
I'd like to voice my support in having aggregations be optional. Like @thangbn, I have a lot of data that's already processed and aggregated, and would love to just be able to plot that. Dummy aggregations are mostly fine but sometimes difficult. I understand that this might be difficult to disentangle from the assumptions made in the Superset backend, but I thought I'd contribute this show of support anyway. Thanks ! |
|
The work-around doesn't work for pre-calculated percentages. In the pivot table does some kind of operation on them instead of just displaying the data that was pre-calculated - resulting in values like |
I would like to visual only the raw data WITHOUT the need of apply any kind of aggreation, as the data from the table is already pre-computed aggreated metric values.
Superset version
0.26.3
Expected results
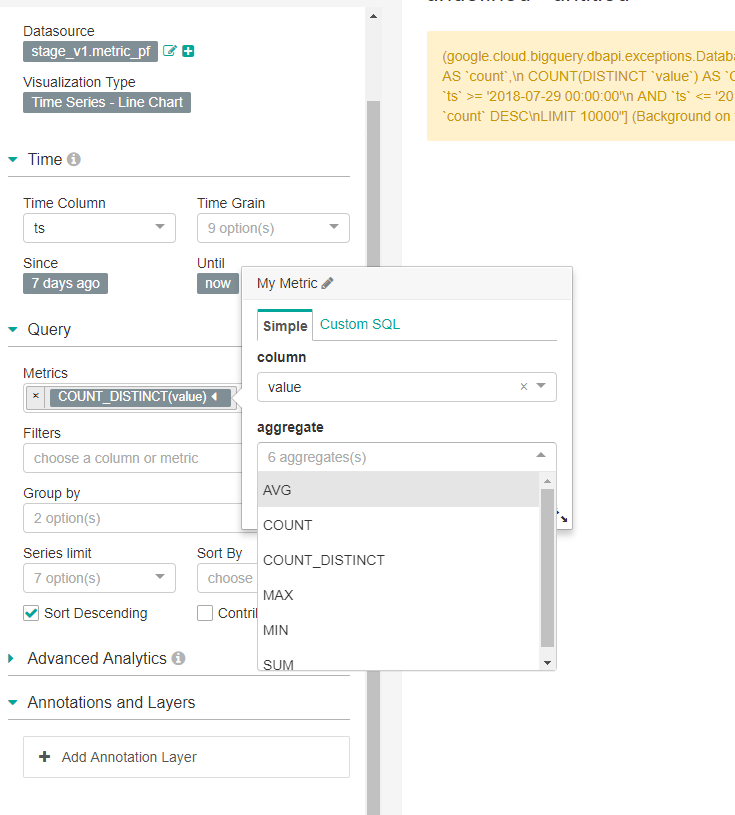
There shouldn't be aggregation enforced for a metric. There should be an option to display the raw metric WITHOUT any aggreation function
Actual results
User must select one of six aggreation available in order to visualize data.
Steps to reproduce
The text was updated successfully, but these errors were encountered: