Skip to content
New issue

Have a question about this project? Sign up for a free GitHub account to open an issue and contact its maintainers and the community.

By clicking “Sign up for GitHub”, you agree to our terms of service and privacy statement. We’ll occasionally send you account related emails.

Already on GitHub? Sign in to your account

Heatmap colorScale not respected #510

Closed
sebastian-raubach opened this issue Apr 14, 2019 · 2 comments
Closed

Heatmap colorScale not respected #510

sebastian-raubach opened this issue Apr 14, 2019 · 2 comments

Comments

@sebastian-raubach
Copy link

I'm trying to use the heatmap plot and set a custom color scale. I was originally trying to only set a specific color for a value of 0, so it's not the default white.
In trying to get this working I noticed that the color scales don't really seem to respect my configuration. Some bits work, but others seem to be ignored:

<template>
   <apexchart type=heatmap height=350 :options="chartOptions" :series="chartSeries" ref="heatmapChart"/>
</template>

<script>
export default {
  data: function () {
    return {
      chartOptions: {
        dataLabels: {
          enabled: false
        },
        title: {
          text: 'Test'
        },
        heatmap: {
          colorScale: {
            ranges: [{
              from: -1,
              to: 14,
              color: '#000000',
              name: 'low'
            },
            {
              from: 14,
              to: 20,
              color: '#128FD9',
              name: 'medium'
            },
            {
              from: 21,
              to: 45,
              color: '#FFB200',
              name: 'high'
            }]
          }
        }
      },
      chartSeries: [{
        name: 'Dec',
        data: new Array(31).fill(0)
      }, {
        name: 'Nov',
        data: new Array(31).fill(0)
      }, {
        name: 'Oct',
        data: new Array(31).fill(0)
      }, {
        name: 'Sep',
        data: new Array(31).fill(0)
      }, {
        name: 'Aug',
        data: new Array(31).fill(0)
      }, {
        name: 'Jul',
        data: new Array(31).fill(0)
      }, {
        name: 'Jun',
        data: new Array(31).fill(0)
      }, {
        name: 'May',
        data: new Array(31).fill(32)
      }, {
        name: 'Apr',
        data: new Array(31).fill(100)
      }, {
        name: 'Mar',
        data: new Array(31).fill(0)
      }, {
        name: 'Feb',
        data: new Array(31).fill(0)
      }, {
        name: 'Jan',
        data: new Array(31).fill(1)
      }]
    }
  }
}
</script>

<style>
</style>

What I would expect this to do is color everything between -1 and 14 in black (or grey depending on the actual value in that range), but the result is white as can be seen in this screenshot:
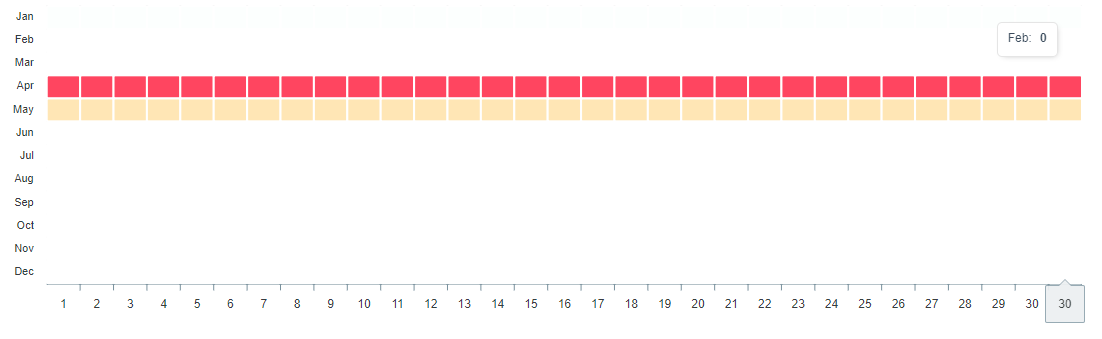
2019-04-14 11_48_06-Frickl

Any ideas?

@junedchhipa junedchhipa transferred this issue from apexcharts/vue-apexcharts Apr 14, 2019
@junedchhipa
Copy link
Contributor

Thanks for raising the issue, I will take a look soon.
Closing this as it seems like a duplicate of #508

@sebastian-raubach
Copy link
Author

Not entirely sure it's a duplicate. Here the "1" values aren't colored either. The whole January column is set to be 1s.

Sign up for free to join this conversation on GitHub. Already have an account? Sign in to comment
Labels
None yet
Projects
None yet
Development

No branches or pull requests

2 participants