Skip to content
New issue

Have a question about this project? Sign up for a free GitHub account to open an issue and contact its maintainers and the community.

By clicking “Sign up for GitHub”, you agree to our terms of service and privacy statement. We’ll occasionally send you account related emails.

Already on GitHub? Sign in to your account

Multi axis line chart yaxis negative bug #41

Closed
arkhenstone opened this issue Jan 10, 2019 · 2 comments
Closed

Multi axis line chart yaxis negative bug #41

arkhenstone opened this issue Jan 10, 2019 · 2 comments
Labels
bug Something isn't working

Comments

@arkhenstone
Copy link

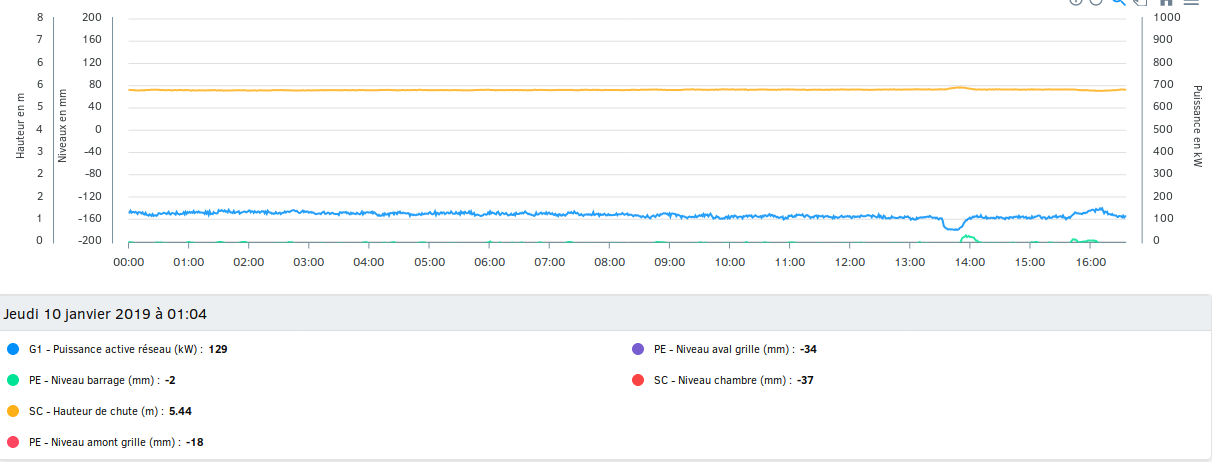
If you dynamically add data with negative axis (like from -200 to 200) and don't put them first in the order of the axis, the lines draw like the 0 is at the bottom. It works well if the axis are sorted by axis_min. I can't provide a codepen as of now but will add it later.

First axis and data is a 0 to positive axis :
image

With axis and data sorted by axis min :
image

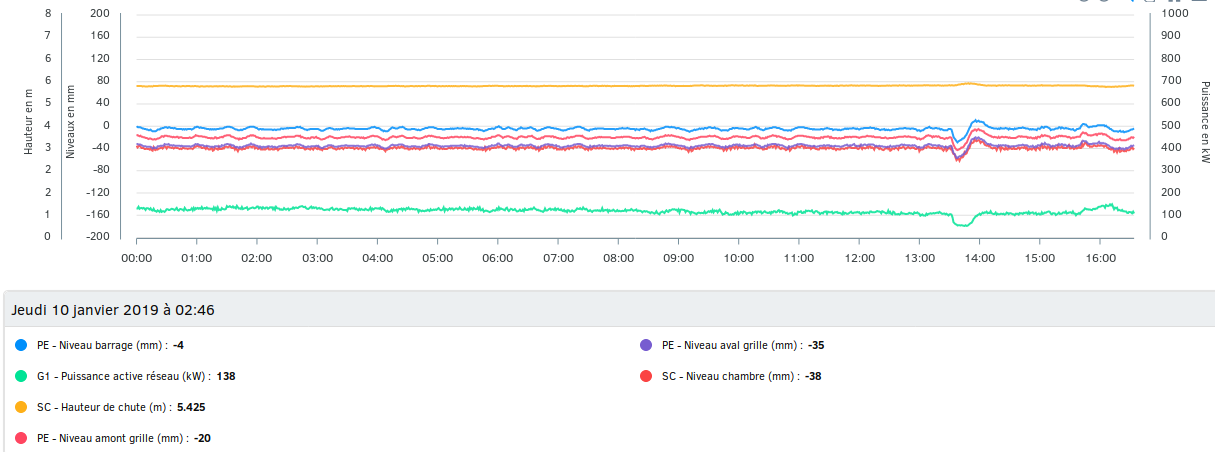
I suppose this is a minor forget somewhere but I'm willing to build up a codepen if needed.

@junedchhipa
Copy link
Contributor

Good to see you again @arkhenstone 😁
I would appreciate a codepen demo to quickly fix the bug.

@arkhenstone
Copy link
Author

arkhenstone commented Jan 15, 2019

Finally had the time to make it : https://codepen.io/arkhenstone/pen/yGRKwP
Notice I've put colors hard coded so they are not tied to the same series.

@junedchhipa junedchhipa added the bug Something isn't working label Jan 15, 2019
Sign up for free to join this conversation on GitHub. Already have an account? Sign in to comment
Labels
bug Something isn't working
Projects
None yet
Development

No branches or pull requests

2 participants