Skip to content
New issue

Have a question about this project? Sign up for a free GitHub account to open an issue and contact its maintainers and the community.

By clicking “Sign up for GitHub”, you agree to our terms of service and privacy statement. We’ll occasionally send you account related emails.

Already on GitHub? Sign in to your account

Strange case 'Out of memory' #133

Closed
DisDis opened this issue Dec 4, 2020 · 8 comments · Fixed by #136
Closed

Strange case 'Out of memory' #133

DisDis opened this issue Dec 4, 2020 · 8 comments · Fixed by #136

Comments

@DisDis
Copy link
Contributor

DisDis commented Dec 4, 2020

I created special repo for reproduce: https://github.com/DisDis/flutter-pi-oom

Host:

  1. clone flutter-pi-oom
  2. copy gen_snapshot_linux_x64 to project root
  3. Build release version ./build_linux.sh && ./build_aot.sh

RaPi:

  1. create flutter-pi-oom folder and flutter-pi-oom/images
  2. copy flutter-pi, icudtl.dat, libflutter_engine.so.debug, libflutter_engine.so.release to flutter-pi-oom/
  3. copy flutter-pi-oom/build/flutter_assets to RaPi flutter-pi-oom/flutter_assets
  4. extract images.7z all files to flutter-pi-oom/images
  5. delete images.7z
  6. exec ./run.sh or flutter in release mode
  7. wait 10min, OOM :)

This application does not consume memory directly.
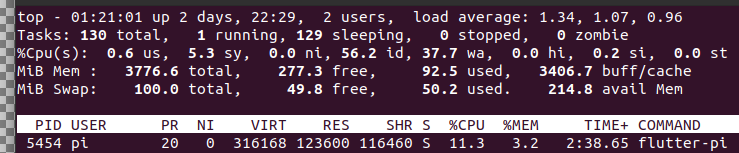
However, the 'buff/cache'(in TOP command) is leaking gradually.
Init: 761mb 'buff/cache'
image
After 1min: 1339mb
image
after 3min: 2195mb
image
after 5min: 3048mb
image
after 8min: 3400mb
image


System slows down
after KILL process: buff/cache free
image

MySystem : RaPi4 (4Gb)
i tried on kernel:

Linux raspberrypi 5.4.35-v7l+ #1314 SMP Fri May 1 17:47:34 BST 2020 armv7l GNU/Linux

and

Linux raspberrypi 4.19.118-v7l+ #1311 SMP Mon Apr 27 14:26:42 BST 2020 armv7l

the result is the same.

I noticed that memory leak happens after somes effects 'DepthEffect, ForegroundToBackgroundEffect...' ( see https://github.com/DisDis/flutter-pi-oom/blob/master/lib/effects.dart#L18 and https://github.com/DisDis/flutter-pi-oom/blob/master/lib/main.dart#L85 )

@ardera
Copy link
Owner

ardera commented Dec 6, 2020

I did some debugging (which was actually a bit time consuming tbh). If you look up the explanation to what buff/cache means, it'll say that it's the sum of the memory consumed by raw hard drive buffers plus the file system page cache. Though the second thing is a bit misleading, since on linux, devices are files too, so it can also be some device memory.

To find out what is using memory in the flutter-pi process, you can cat /proc/<flutterpi pid>/maps. If you use diff to track the changes from time to time, you'll see there's a steady increase of memory regions mapped from /dev/dri/renderD128, which is the render interface of the GPU. The only thing I could think of taking this much memory from the GPU is textures. It seems the textures for the images are created but never released.

The issue seems to be the call to precacheImage.

There's a warning about this in the documentation to precacheImage:

Callers should be cautious about pinning large images or a large number of images in memory, as this can result in running out of memory and being killed by the operating system. The lower the available physical memory, the more susceptible callers will be to running into OOM issues. These issues manifest as immediate process death, sometimes with no other error messages.

It's also important to note that while the image files themselves are only 20kB, they are heavily compressed jpegs. When they're stored in GPU memory as textures, they are uncompressed and take up about 16MiB (= 2560px * 1600px * 4 bytes per pixel) each.

@DisDis
Copy link
Contributor Author

DisDis commented Dec 6, 2020

yes, I did such research too. so i call 'imageCache.clear()' ( https://github.com/DisDis/flutter-pi-oom/blob/master/lib/main.dart#L116 ). But the memory is not returned :(.
I don’t understand how to fix it yet. there is no problem on the emulator.
thanks for confirming my assumptions.

@ardera
Copy link
Owner

ardera commented Dec 7, 2020

You're right, i missed that. You even added some debug output in the app that lists the live image count, I missed that too. Actually I added some logging to glGenTextures and glDeleteTextures and it seems like flutter is doing everything correctly. The number of live textures is always between 5 and 46. Nothing explaining the high GPU memory usage.

Interestingly, the depth effect seems to be creating and deleting a lot of textures. Maybe something in the driver is leaking memory there? Maybe upgrading to latest mesa3d will bring a difference, the default mesa on raspberry pi is quite old.

@DisDis
Copy link
Contributor Author

DisDis commented Dec 7, 2020

@ardera Is there some branch with log?
i'm going to dig in both direction(driver and flutter-pi).
if there was a leak in the driver, it would be noticed in other applications.

@ardera
Copy link
Owner

ardera commented Dec 7, 2020

@ardera Is there some branch with log?

Just pushed it, the branch is called graphics-logging

if there was a leak in the driver, it would be noticed in other applications.

True, it's less likely. Memory leaks in mesa aren't that uncommon though, if you look at the release notes. Also, mesa has inbuilt support for valgrind for debugging memory leaks, which also seems to hint that memory leaks aren't that uncommon.
There's another reason I want to build mesa myself though, which is that the VC4 / V3D driver inside it has some graphics buffer logging that can be enabled when you compile it yourself.

@ardera
Copy link
Owner

ardera commented Dec 7, 2020

the VC4 / V3D driver inside it has some graphics buffer logging

Just ran flutter-pi with the logging. According to the driver logging, the number of buffer objects allocated, and the size of the BOs combined grows steadily. I think with some additional logging it should be possible to find out what BOs aren't freed

@ardera
Copy link
Owner

ardera commented Dec 9, 2020

Was entirely my fault. Forgot to restore some OpenGL state after presenting. Then, when flutter tried to delete some textures after my present function was called, there was no OpenGL context bound and the textures weren't deleted, causing the OOM. It's fixed now

@DisDis
Copy link
Contributor Author

DisDis commented Dec 9, 2020

thanks, a lot of work has been done.

Sign up for free to join this conversation on GitHub. Already have an account? Sign in to comment
Labels
None yet
Projects
None yet
Development

Successfully merging a pull request may close this issue.

2 participants