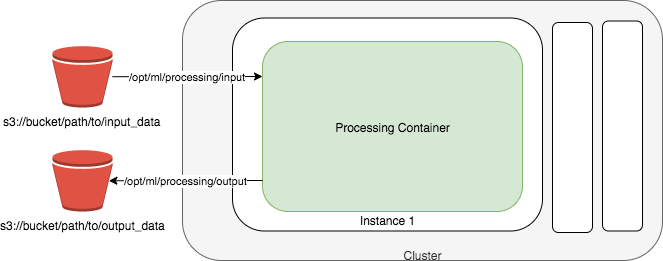
Amazon SageMaker Processing is a managed solution for various machine learning(ML) processes. These include feature engineering, data validation, model evaluation, model explainability, and many other essential steps performed by engineers and data scientists during their ML workflow.
Your custom processing scripts will be containerized running in infrastructure that is created on demand and terminated automatically. You can choose to use a SageMaker optimized containers for popular data processing or model evaluation frameworks like Scikit learn, PySpark etc. or Bring Your Own Containers (BYOC).
Postprocess and model evaluation are important steps before deployment the model to production. In this module you will use ScriptProcessor from SageMaker Processing to evaluate the model performance after the training.
To setup your ScriptProcessor, we will build a custom container for a model evaluation script which will Load the tensorflow model, load the test dataset and annotation (either from previous module or run the :code[optional-prepare-data-and-model.ipynb] notebook), and then run predicition and generate the confusion matrix.
Download the notebook into your environment, and you can run it by simply execute each cell in order. To understand what's happening, you'll need:
- Access to the SageMaker default S3 bucket.
- Familiarity with Python and numpy
- Basic familiarity with AWS S3.
- Basic understanding of AWS Sagemaker.
- Basic familiarity with AWS Command Line Interface (CLI) -- ideally, you should have it set up with credentials to access the AWS account you're running this notebook from.
- SageMaker Studio is preferred for the full UI integration
The dataset we are using is from Caltech Birds (CUB 200 2011). If you kept your artifacts from previous labs, then simply update the s3 location below for you Test images and Test data annotation file. If you do not have them, just run the optional-prepare-data-and-model.ipynb notebook to generate the files, and then update the path below.
- S3 path for test image data
- S3 path for test data annotation file
- S3 path for the bird classification model
At the end of the lab, you will generate a json file containing the performance metrics (accuracy, precision, recall, f1, and confusion matrix) on your test dataset.
The notebook in Module 5b describes Image Classification ML model explainability using SageMaker Clarify
Amazon SageMaker Clarify provides machine learning (ML) developers with purpose built tools to gain greater insights into their ML training data and models. Amazon Clarify detects and measures potential bias using a variety of metrics so that they can address potential bias, and explain model predictions.
Amazon SageMaker Clarify can detect potential bias during data preparation, after model training, and in your deployed model. For instance, you can check for bias related to age in your dataset or in your trained model and receive a detailed report that quantifies different types of potential bias. SageMaker Clarify also includes feature importance scores that help you explain how your model make predictions and produces explainability reports in bulk or real time via online explainability. You can use these reports to support customer or internal presentations, or to identify potential issues with your model.
Understand which features contributed the most to model prediction
SageMaker Clarify is integrated with SageMaker Experiments to provide scores detailing which features contributed the most to your model prediction on a particular input for tabular, NLP and computer vision models. For tabular datasets, SageMaker Clarify can also output an aggregated feature importance chart which provides insights into the overall prediction process of the model. These details can help determine if a particular model input has more influence than expected on overall model behavior. For tabular data, in addition to the feature importance scores, you can also use partial dependence plots (PDP) to show the dependence of the predicted target response on a set of input features of interest.
Download the notebook into your environment, and you can run it by simply execute each cell in order. To understand what's happening, you'll need:
- Access to the SageMaker default S3 bucket.
- Familiarity with Python and numpy
- Basic familiarity with AWS S3.
- Basic understanding of AWS Sagemaker.
- Basic understanding of AWS Sagemaker Clarify.
- Basic familiarity with AWS Command Line Interface (CLI) -- ideally, you should have it set up with credentials to access the AWS account you're running this notebook from.
- SageMaker Studio is preferred for the full UI integration
The dataset we are using is from Caltech Birds (CUB 200 2011). If you kept your artifacts from previous labs, then simply update the s3 location below for you Test images and Test data annotation file.
- S3 path for test image data
- S3 path for test data annotation file
- S3 path for the bird classification model
At the end of the lab, you will download the results of the clarify explainability job and can see the SHAP values as well as the heat map of the pixels for your image classification