Skip to content
This repository has been archived by the owner on Aug 22, 2023. It is now read-only.

Visualizer #1

Closed
bdlukaa opened this issue Jul 26, 2021 · 0 comments
Closed

Visualizer #1

bdlukaa opened this issue Jul 26, 2021 · 0 comments
Assignees
Labels
enhancement New feature or request help wanted Extra attention is needed

Comments

@bdlukaa
Copy link
Owner

bdlukaa commented Jul 26, 2021

Create a visualizer app to help developers see, in graphics, the data collected by Analytics and Crashlytics Addons.

It should be something like the following image:
Firebase Analytics

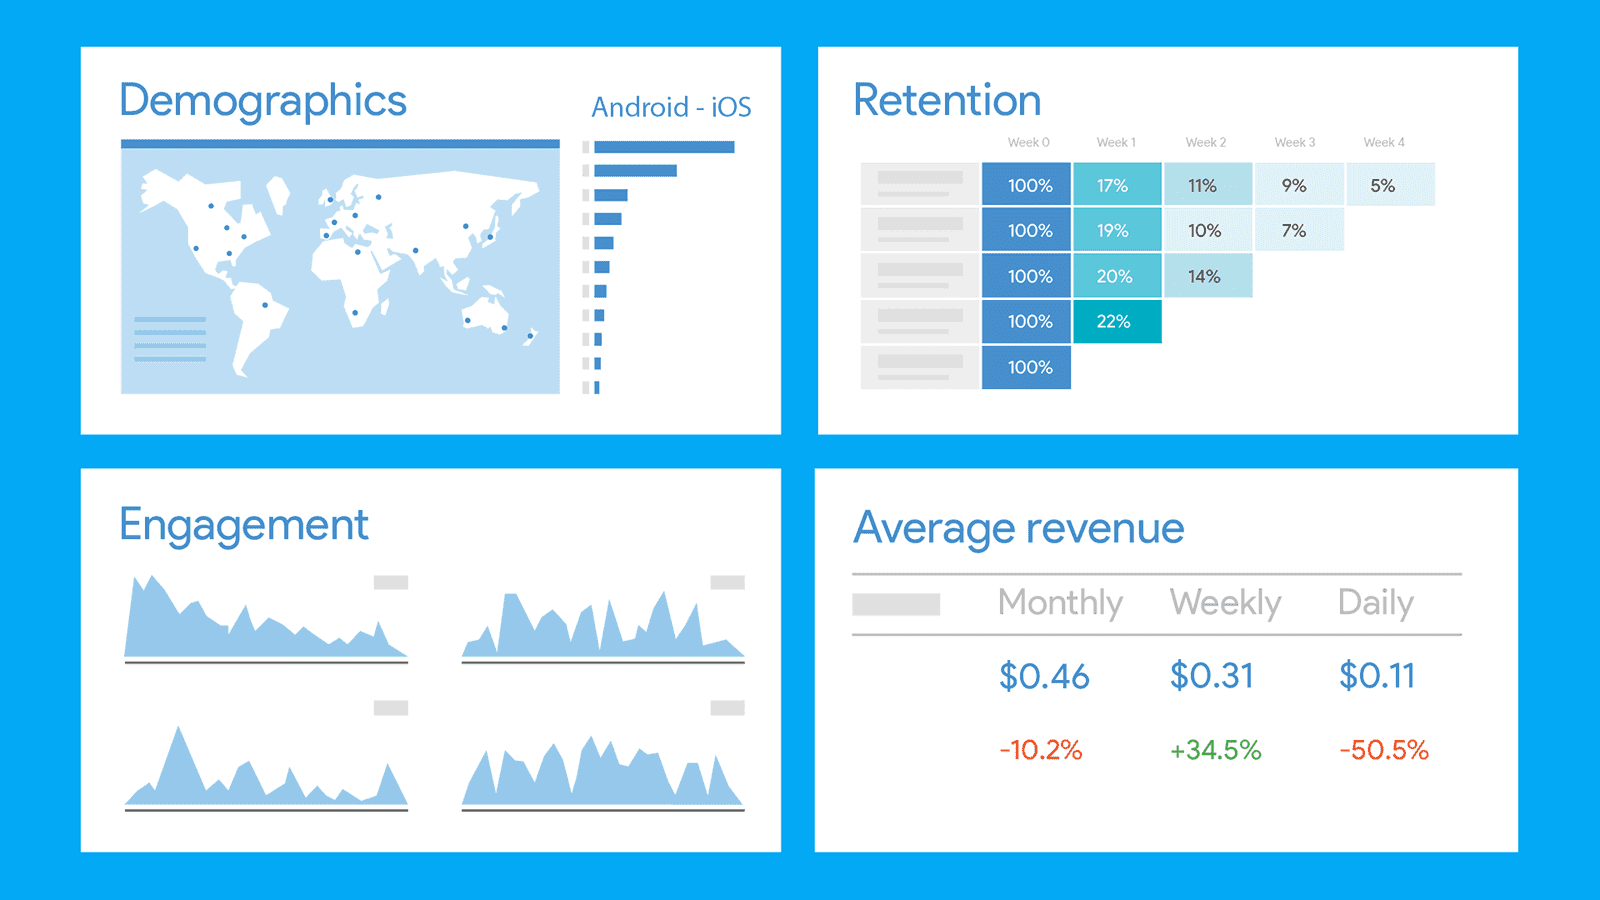
With the current Analytics implementation, we can visualize the following data:

  • The user country
  • The user operational system

More coming soon

@bdlukaa bdlukaa added enhancement New feature or request help wanted Extra attention is needed labels Jul 26, 2021
@bdlukaa bdlukaa self-assigned this Jul 26, 2021
@bdlukaa bdlukaa pinned this issue Jul 26, 2021
@bdlukaa bdlukaa closed this as completed Aug 6, 2021
Sign up for free to subscribe to this conversation on GitHub. Already have an account? Sign in.
Labels
enhancement New feature or request help wanted Extra attention is needed
Projects
None yet
Development

No branches or pull requests

1 participant