GDB Remote failure when hitting a breakpoint (new target) #1795
Comments
|
We've got a couple of questions for you as that's some really whacky behaviour and we'll try and explain why below: 1) what GDB is this, and 2) where is the Flash and SRAM in this part located? Now, as for what's going on: the Looking at the GDB documentation this is caused by a stupid that GDB's done which at least historically was mitigated by looking to see how many digits followed the 'E' and if more than 2, interpret as register data, if only 2, interpret as an error code - see the GDB docs on the 'g' packet. We suspect this is a bug in the GDB you're using. |
|
While looking at your branch, forgetting it is not a PR yet, we wound up doing a review on the main commit 😅; Hopefully the early feedback helps. |
|
Thanks a lot for your time and feedback, much appreciated! Let's tart with questions:
GDB version actually sketches me out a bit, it's pretty old. I just made a project in platformIO and used ARM compiler it has by default. Somehow, it uses this version. I'll try a newer one. The explanation on GDB's handling of response makes a lot of sense (but sketchy 😅 ) As for the review, I have cleaned up debug mess, and adjusted the addresses according to the description above. I can see that the use of gdb_outf is problematic, but it's a temporary solution to test my changes, as Tiva ICDI platform doesn't support debug logging. |
|
It's a GDB problem. I made a test where I modified gdb_main.c so that it always returns the same first 4 bytes, like so: Then I ran the following GDB commands: During attach, GDB requests the registers and gets the crafted message from above. Then I tested on 3 different GDB versions:
So I went digging in GDB's git and found a commit that fixed this https://sourceware.org/bugzilla/show_bug.cgi?id=9665 Mystery solved, this can be closed 😀 If you think adding the support for MK20 from this branch with some more polishing would be valuable for this project, I'd like to send a PR. |
Neither did blackpill-f4 (properly), that is until I dug deep and sorted it out in #1715. You can do a similar thing with The GDB 7 you've used is old, please get something modern like xPack 12. It can be an Arduino tool archive, e.g. stm32duino core depends on xpack-gcc-arm-none-eabi-12 (or newer). Generally, you don't have to use the gdb/gdb-py/gdb-py3 from the toolchain that was used to compile a firmware, just the EABI should match (excluding ESP Xtensa complications). How is your MK20DX256 Teensy 3.2 wired? Is onboard MKL02 chip disabled/detached or you're using it for uploads? https://mcuoneclipse.com/2017/04/29/modifying-the-teensy-3-5-and-3-6-for-arm-swd-debugging/ 32 KiB of KL02 is too small to have any hope of porting BMF onto it, so external wires it is then. Proper PRs undergo autobuilds and linters sometimes not set up on contributors' machines (pre-commit, clang-format), and I'm not sure how much more of PR216 is useful here, so no comment on this. I've been bitten by |
Well there we go 😄 excellent! We should add a note then that ARM GDB 7.10.1 is borked.
We'd love that - we look forward to seeing a PR for it. If you would like to contribute to the ICDI platform, that would be another very welcome PR. ALTracer gives some useful hints above about how to get debug enabled on that platform. The 256kiB Flash of the Tiva-C used (TM4C123GH6PMI) should handily fit everything, and has plenty of endpoints in the USB controller to implement things like the debug serial link w/o compromises. |
Hi, I'm playing with around with adding support for NXP MK20DX256 (Teensy 3.2 board), that I would eventually like to contribute with to this repo.
I am working on a recent branch with just a handful of changes https://github.com/vedranMv/blackmagic/commits/kinetis_mk20/.
Hardwarewise, I'm using Tiva ICDI (flashed with the branch above), connected to the JTAG interface of an MK20.
For the most part, everything runs as expected. Scanning for devices (mon jtag_scan), loading firmware, running, pausing, resuming, viewing registers, monitoring variables - most of what I can think. Except for breakpoints.
Whenever a breakpoint is set, and it gets hit, GDB reports remote failure error like so
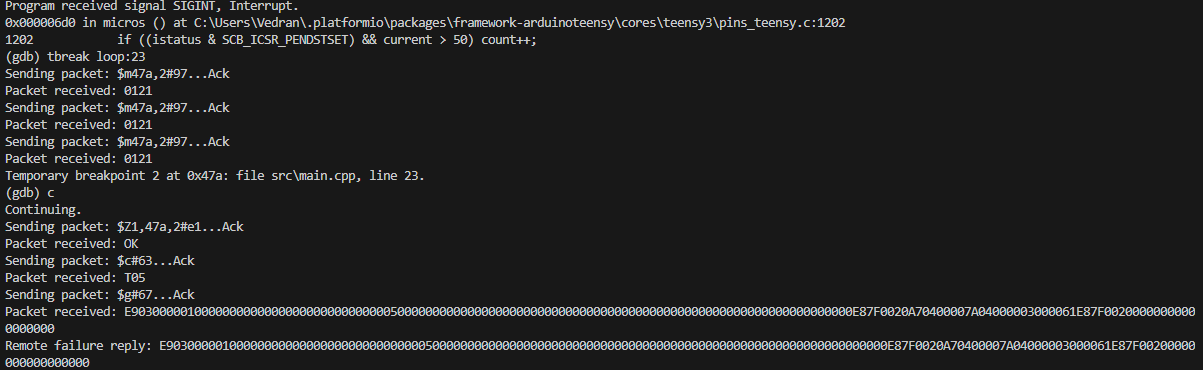
It doesn't matter if it's a permanent (break ...), temporary (tbreak ...) or software (
__asm__("BKPT");) breakpoint. What they all have in common is that the error comes after GDB requests registers ("$g" packet in the screenshot above).There's a bit more information on these two links, where I tried to document what I did:
https://hackaday.io/project/195502-debugging-on-a-teensy-the-open-source-way/log/228746-gdb-debugging
https://hackaday.io/project/195502-debugging-on-a-teensy-the-open-source-way/log/228787-debugging-the-debug-session
But in general, it seems like the issue is related to "$g" command that requests registers, in a way that I do not understand.
For fun, I tried to comment out a switch cases that handles 'g' command in gdb_main.c:127, and that actually 'fixed' the error. As a result, registers don't get updated after a breakpoint is hit (but they do if I just step through the code).
I know it might be a long shot, but I'm wondering if anyone has any ideas what's happening here or what else to try out. I'm working on getting one of the supported targets instead of MK20 to test on, but I don't really have another debug probe to try.
The text was updated successfully, but these errors were encountered: