Pulse project aims make healthcheck process for various providers so simply, also have 2 notification options for now.
Optionally you can specify database and configuration file with -config and -database flags.
   _ (`-.                         .-')      ('-.
  ( (OO  )                       ( OO ).  _(  OO)
 _.`     \,--. ,--.    ,--.     (_)---\_)(,------.
(__...--''|  | |  |    |  |.-') /    _ |  |  .---'
 |  /  | ||  | | .-')  |  | OO )\  :` `.  |  |
 |  |_.' ||  |_|( OO ) |  |`-' | '..`''.)(|  '--.
 |  .___.'|  | | `-' /(|  '---.'.-._)   \ |  .--'
 |  |    ('  '-'(_.-'  |      | \       / |  `---.
 `--'      `-----'     `------'  `-----'  `------'

Pulse Version: 0.1.0

Go Version: go1.10.3
GOOS: linux
GOARCH: amd64
Num CPU: 4
GOPATH: /home/blueskan/go
GOROOT: /usr/local/go
Compiler: gc

Process Execution Time: Saturday, 16 Mar 2019
[2019-03-16 23:32:58] [INFO]: Open configuration file `./config.yaml`
[2019-03-16 23:32:58] [SUCCESS]: Parse configuration successfully
[2019-03-16 23:32:58] [SUCCESS]: Web Server listening on port 7051
[2019-03-16 23:32:58] [INFO]: Starting scheduling healthchecks with 1 providers
[2019-03-16 23:32:58] [INFO]: Healthcheck scheduling starting for `custom_test`.
[2019-03-16 23:32:58] [INFO]: Doing healthcheck for service custom_test.
[2019-03-16 23:32:59] [SUCCESS]: Healthcheck successful for `custom_test`, elapsed time: 534 milliseconds
[2019-03-16 23:32:59] [INFO]: Healthcheck scheduling starting for `custom_test`.
[2019-03-16 23:33:09] [INFO]: Doing healthcheck for service custom_test.
[2019-03-16 23:33:09] [SUCCESS]: Healthcheck successful for `custom_test`, elapsed time: 276 milliseconds
[2019-03-16 23:33:09] [INFO]: Healthcheck scheduling starting for `custom_test`.
[2019-03-16 23:33:19] [INFO]: Doing healthcheck for service custom_test.
[2019-03-16 23:33:19] [SUCCESS]: Healthcheck successful for `custom_test`, elapsed time: 262 milliseconds
[2019-03-16 23:33:19] [INFO]: Healthcheck scheduling starting for `custom_test`.
[2019-03-16 23:33:19] [INFO]: Notify service `custom_test` status change to `slack`.
[2019-03-16 23:33:20] [SUCCESS]: Successfully notify service `custom_test` status change to `slack`.
[2019-03-16 23:33:20] [INFO]: Notify service `custom_test` status change to `email`.
[2019-03-16 23:33:20] [SUCCESS]: Successfully notify service `custom_test` status change to `email`.
There are 2 configuration method for Pulse.
- YAML Configuration
- JSON Configuration
Configuration concept divided to 2 paradigms.
- Global Configuration
- Per Healthcheck rule configuration
Global configuration consist of persistence option, web ui like overall system settings. Also consist of sane defaults of health checks, for example if you not specify check_interval on single healthcheck its overrides with this global value.
Simple syntax for configuration in yaml format:
# Global Configuration
global:
  collect_stats: false
  audit_log_rotation_enabled: true
  audit_log_rotation: 20
  response_log_rotation_enabled: true
  response_log_rotation: 20
  web_ui:
    port: 7051 # Web UI Port [/ => json response, /stats => if collect_stats open you can show statistics]
    failure_status_code: 400 # Failure status code for json response ( if any of services down )
    audit_log_limit: 10
    response_log_limit: 10
  notifiers:
    threshold: 30
    services:
      slack:
        url: "https://hooks.slack.com/services/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"
        message: "Service `${service_name}` has been down since `${duration}`."
        extra: "channel:#general,username:Gopheart"
      email:
        url: "smtp://test:test@email.test.com:1025"
        message: "Service `${service_name}` has been down since `${duration}`."
  retry_policy:
    timeout: 3s
    down_threshold: 3
    up_threshold: 3
  check_interval: 10s

# Health Checks
health_checks:
  ping_batikansenemoglu_com:
    type: custom
    source: python ./custom/ping.py
    check_interval: 30s
    retry_policy:
      timeout: 3s
      down_threshold: 3
      up_threshold: 3
    notifiers:
      threshold: 15
      services:
        slack:
          message: "Hey its custom message i cant access batikansenemoglu.com :("
Healthcheck states are defined like this:
Initial: Initial state of healthcheck definitionUnhealthy: This state indicate obviously your service is downSick: This state is temporary between Healthy and Unhealthy statesHealthy: Everything is good :)
All Global Configurations:
collect_stats[bool] - Manage persistence mode if you open this after exit pulse process, your previous healthcheck response logs and audit logs stay. More technical details: it's creates db file in your file system, it`s simply consist of msgpack encoded statistics information. And after you re-run process it's load this database.audit_log_rotation_enabled[bool] - Too many audit logs is not good for performance manner and space complexity, you can enable this option for more reduced disk footprint.audit_log_rotation[int] - If you enableaudit_log_rotation_enabledthen this configuration key is all about limit the audit logs.response_log_rotation_enabled[bool] - Same with audit_log_rotation_enabledresponse_log_rotation[int] - Same with audit_log_rotationweb_ui.port[int] - Web UI port for Pulseweb_ui.failure_status_code[int] - If any service in health checks definition failed this status code send from server instead of HTTP 200 OK.web_ui.audit_log_limit[int] - Limits the audit logs in json response.web_ui.response_log_limit[int] - Limits the response logs in json response.notifiers[Notifier] - Notification defaults, notification services and threshold.notifiers.threshold[int]: Think of case like your service is down and health check translate to unhealthy state, if you give threshold to 30 it's notify service is still down information after every 30 times healthcheck.retry_policy.timeout[string] - Timeout duration for health check request.retry_policy.down_threshold[int] - In example if you specify this value 3, after get 3 times error from healthcheck, healthcheck state transition to sick.retry_policy.up_threshold[int] - Same with down_threshold but works for healthy state.check_interval[string] - Global check interval, this value override health check definitions which is check_interval definition omitted.
Anatomy of Health check definition:
health_checks:
    zeus_caching_server:
        type: redis
        source: redis://172.17.0.2:6379
        notifiers:
          threshold: 30
          services:
            slack:
              url: "https://hooks.slack.com/services/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"
              message: "Service `${service_name}` has been down since `${duration}`."
              extra: "channel:#general,username:Gopheart"
    hades_caching_server:
        type: memcache
        source: 172.17.0.4:11211
        retry_policy:
          timeout: 3s
          down_threshold: 3
          up_threshold: 3
Think of configuration above;
There are 2 definitions zeus_caching_server which is redis, hades_caching_server which is memcache.
You see retry_policy definitions exists in hades_caching_server, but beside of this zeus_caching_server not have this values.
This means zeus_caching_server using global settings.
typeparameter is deterministic about what kind of health check you do.sourceparameter is addresses of servers.notifiersparameter is notification
Provider is simply method for say to pulse how achieve healthcheck process.
Supported Providers:
- Url Provider
- Simply makes get request to url if response is OK, it's healthy if it's not then unhealthy
- Redis Provider
- Memcache Provider
- MongoDB Provider
- MySQL Provider
- PostgreSQL Provider
- MSSQL Provider
- Cassandra Provider
- CouchBase Provider
- HBase Provider
- ElasticSearch Provider
- Solr Provider
- RabbitMQ Provider
All providers more or less same but you can add any provider with help of special
provider Custom Provider
Here`s example of Custom Provider
custom/ping.py:
import os
import sys

hostname = "batikansenemoglu.com"
response = os.system("ping -c 1 " + hostname)

if response == 0:
  sys.exit(0)
else:
  sys.exit(1)
config.yaml:
health_checks:
  ping_batikansenemoglu_com:
    type: custom
    source: python ./custom/ping.py
    check_interval: 30s
    retry_policy:
      timeout: 3s
      down_threshold: 3
      up_threshold: 3
    notifiers:
      threshold: 15
      services:
        slack:
          message: "Hey its custom message i cant access batikansenemoglu.com :("
        email:
          url: "smtp://username:password@pulse.com:25"
          message: "Service `${service_name}` has been down since `${duration}`."
          extra: "from:alert@pulse.com,title:Down Alert - Pulse,recipients:down@pulse.com|incident@pulse.com|sysadmin@pulse.com"
This way you would ping batikansenemoglu.com in every 30 seconds and if any state change occured you would get slack and e-mail notifications.
We define 2 environment variables for every custom type health checks SERVICE_NAME and TIMEOUT.
Notifiers report healthcheck results to you.
Supported Notifiers:
- Slack Notifier
- Mail Notifier
- Prometheus Exporter Notifier [ Late Release ]
Notifier message placeholders:
${service_name}- Key of healthcheck definition${duration}- Duration between now and latest failure.${previous_state}- Previous State${new_state}- New State
Features:
- Easy configuration JSON or YAML
- Smart scheduling between health checks
- Audit Logging
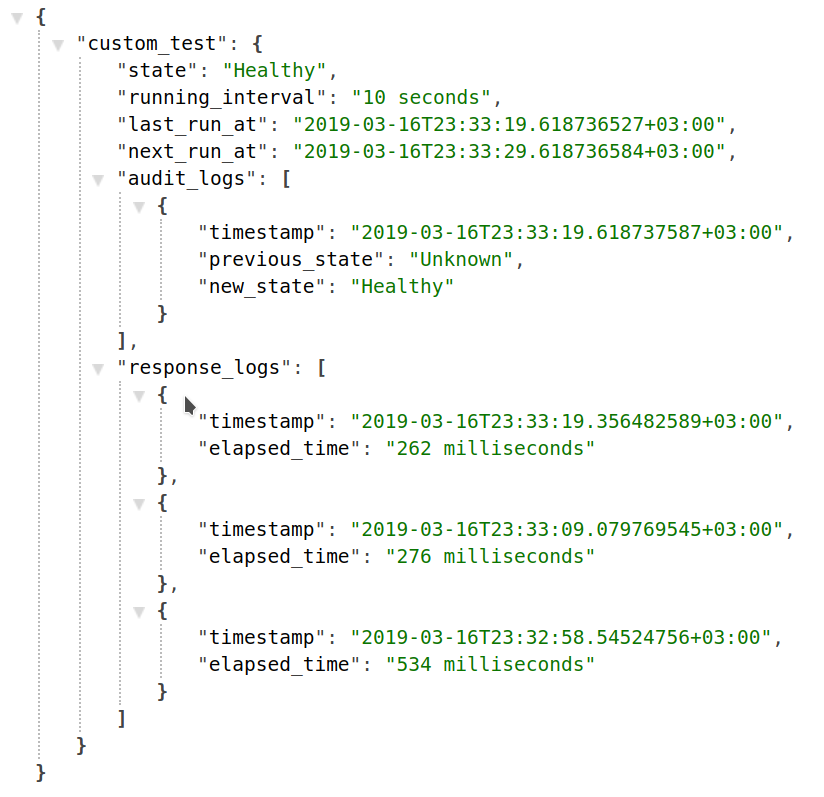
- Creates Json Response automatically with provider infos ( If any error happened in any service you would return specific http status code, you can bind this url to your health check system )
- If you open
stats optionin configuration, /stats endpoint available for downtime stats [ TODO ]
If you want to contribute with any idea or code feel free to send me an e-mail via me@batikansenemoglu.com or pull request.