The React team is currently working on a new concurrent mode API. This enables work to be scheduled with a priority so that React can work on more important tasks (e.g. response to a "click" event) before less important ones (e.g. pre-rendering hidden content). In this mode, React yields every few milliseconds so that the browser (and other, non-React JavaScript) can remain responsive.
One of the things we observed early on was that this type of cooperative scheduling only works if all parties are participating. (If React yields to avoid blocking other JavaScript, then that JavaScript can easily "starve" out React even if it’s working on lower priority tasks.) To address this, we have regular meetings with some folks on the Chrome team to design a native scheduler API that can coordinate priority for framework JS and non-framework JS, and propagate the current priority across built-in APIs (e.g. setTimeout, fetch, Promise). The React team maintains a polyfill for this proposed API named scheduler. The last several releases of React have supported this polyfill.
Facebook app developers have been using both the new concurrent mode API and the scheduling API to create the new Facebook UI, dubbed “FB5”.
React DevTools provides a React-specific profiler that highlights components that take a long time to render or that render unexpectedly. We have traditionally relied on built-in browser profiling tools to dig deeper on CPU bottlenecks (e.g. which specific function calls are slow) and IO bottlenecks (e.g. which network requests are taking a long time to resolve).
With new APIs like concurrent mode and scheduler, there is a gap between framework tooling and existing browser tooling. The built-in tools don't yet have any concept of scheduled/prioritized work. It's all just a flat stream of events. Because of this, Facebook developers working with the these APIs have shared feedback that it can be difficult to identify performance bottlenecks.
To address this issue, the React team has begun work on a prototype profiler that shows the priority JavaScript is running at, along with several key React events (e.g. work is scheduled, a component “suspended", the DOM was mutated). Such a profiler could be extremely basic but would likely be of limited use if it were missing so much surrounding context. A compelling MVP would probably need to include more contextual information (e.g. a script flame graph, network traffic, user input events, maybe even screenshots). Reimplementing these native profiling views would be a lot of effort. It would also be work that would not benefit other frameworks.
Follow the precedent set by other native panels (e.g. ElementsPanel, SourcesPanel) and allow an extension to create its own “pane” (canvas) within the Performance tab. This would enable frameworks like React to display important context inline- in much the same way as the browser current does for things like screenshots and network requests.
This API would probably need to provide the following:
- The extension could specify the size (height) of its UI.
- (Optional) The extension could also specify a label, enabling it to be shown within the accordion UI like existing sections (e.g. “Frames”, “Interactions”, “Main”).
- The extension would either be given a container element to render into (or an
HTMLCanvasElementto draw to) and observe pointer events from. - The extension would have access to the current Trace Events data being viewed in the profiling panel.
- The extension would receive events specifying the currently visible time range (where the user has zoomed in and scrolled to).
Here’s a mockup that illustrates the region I am proposing an extension might be able to render custom UI into:

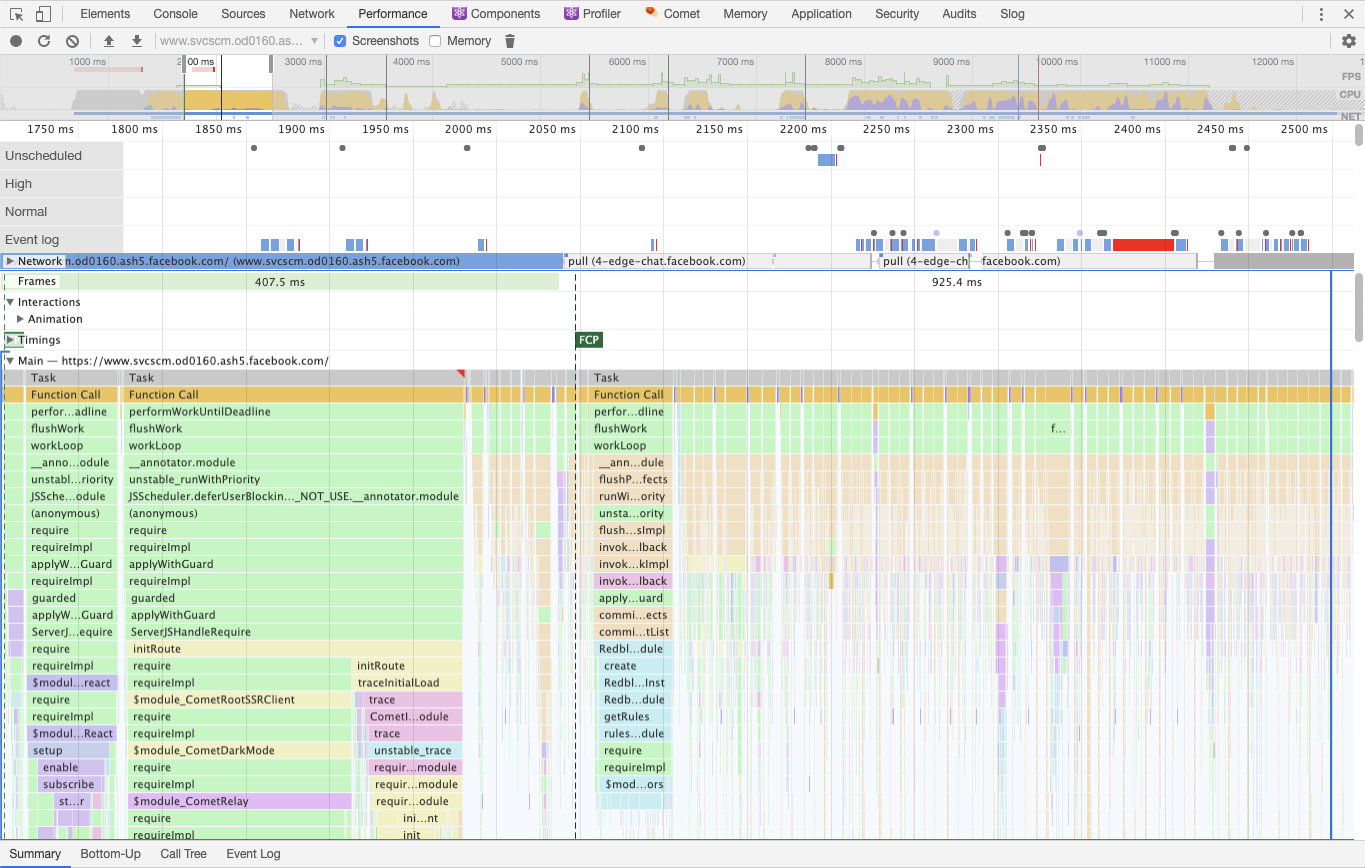
And here’s a mockup showing the current React profiling prototype rendered inline within that area. (Note that the two JavaScript profiles being shown don’t line up.)
Here's a video demo of an integration of the React profiling prototype with the Firefox profiler. (The source code for this integration can be found here.)

We’ve spoken with developers from Angular, Preact, and Vue to see if they would be interested in such an API. High level feedback from them is as follows:
- Angular: This would be beneficial. Even if the core team didn’t use the API, a third party tool like Augury would.
- Preact: Profiling has been on their mind lately. The native Performance tab is useful but often exposes internals that app developers don't understand or care about. Jumping between extension tabs (e.g. Performance and Preact) is jarring when profiling. Some form of rendering custom UI within the Performance tab is on their wishlist.
- Vue: Their needs align with React's for suspense and state update scheduling. They would use such an API to show state mutations inline rather than in a separate tab (their current strategy).
React DevTools already provide some profiling capabilities. We could implement this new profiling view as part of the main extension UI. However there are a few downsides to this approach:
- It would require substantial duplicated effort to re-implement native profiler UIs (e.g. flame graph, network traffic).
- Although both store data using the Trace Event format, differences between profiling data recorded by e.g. Chrome and Firefox would require separate parsing logic.
- The current extension APIs are insufficient to enable syncing the currently visible section of profiling data (which time range has been zoomed into) between the Performance tab and the React DevTools extension.
- Having to manually flip between tabs would add substantial context switching cost for developers without a good justification.
The user timing API can provide some context to Performance data, since measured spans are shown inline. React use this API for showing extra context in dev mode. Overall though this API has some major limitations:
- Measurements are slow, making them unsuitable for large scale production usage.
- Discrete events (marks without durations) aren’t shown at all.
- Lack of an API for grouping marks means that product and framework timings get interleaved, often in ways that make them both unreadable.
- Non-interactive labels are limited in how much context they can provide. (For example, marking a state update for a React application would not be very actionable without also providing a “component stack”, but such a stack would be too large to fit in a user timing label.
This API has all of the same limitations of the User Timings API with an additional downside of flooding the developer console with timing information. This would interfere with regular application development and debugging.