Wrong thickness of axis on barchart #1962
Comments
|
I solved the mystery. The issue was that I forgot to include c3.css. Once included it axis are working fine. |
|
Thanks @belczyk I pulled all my hairs out until I found this thread. I had this, fixed by including c3.css |
Sign up for free
to join this conversation on GitHub.
Already have an account?
Sign in to comment
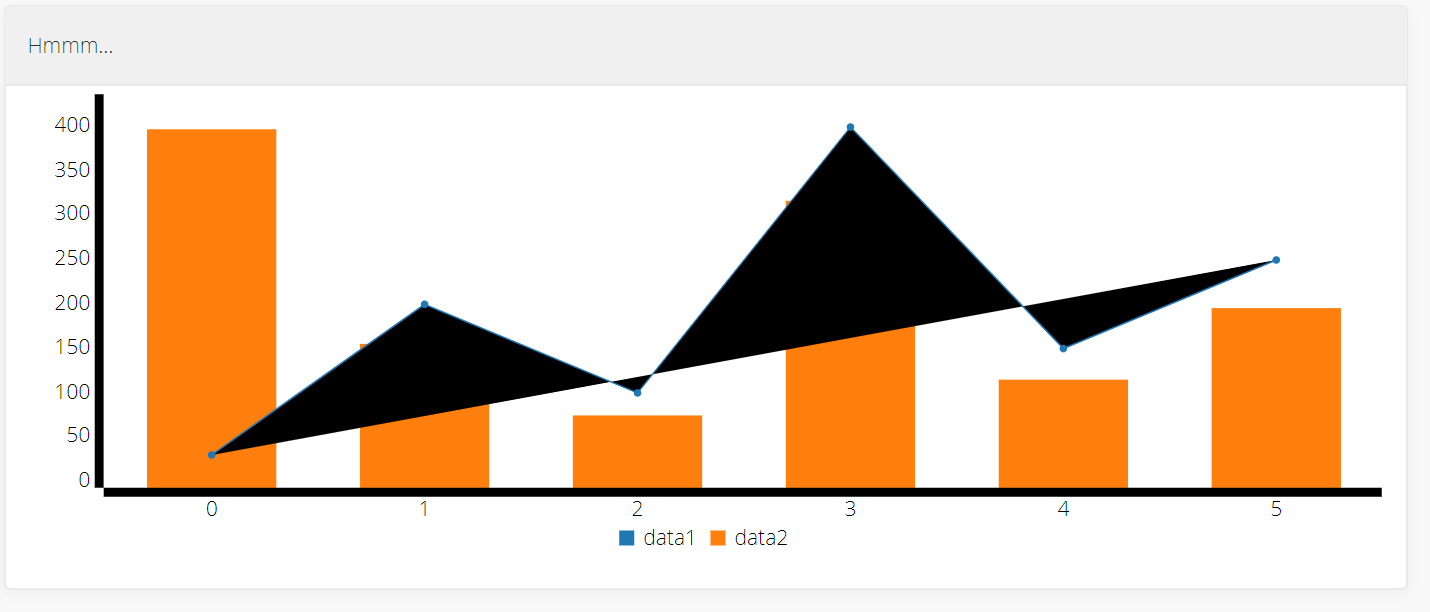
I have simple bar chart with time series, generated as below. But there are some issues with rendering. axis lines are very thick and one of the bars overlaps previous one (see screen below). I removed all styles from solution to make sure that it's not interfering but its not the case.
xs and ys:
The text was updated successfully, but these errors were encountered: