learn prediction intervals (variance, noise) #1148
Comments
|
Maybe that is of interest to you: I am currently working on an extension of CatBoost to probabilistic forecasting https://github.com/StatMixedML/CatBoostLSS It creates probabilistic forecasts from which prediction intervals and quantiles of interest can be derived. It learns all parameters of a distribution and provides inference as well. It is still very developmental though. You may find additional information in the corresponding paper https://128.84.21.199/abs/2001.02121 In case you are interested, I am also extending XGBoost to to probabilistic forecasting. Repo is here https://github.com/StatMixedML/XGBoostLSS and paper here |
Thanks a lot @StatMixedML, it looks very promising, I"ll definitely examine it very closely! |
|
Note sure if I fully get your point, but what CatBoostLSS does it relates all parameters of a distribution to covariates. Say, you specify a Normal distribution, then both mean and sigma are estimated as functions of x, i.e., E(y|x) = f(x) + Sigma(y|x) = f(x). In addition, you get, e.g., Partial Dependence Plots for both E(y|x) and Sigma(y|x) so that you better understand the influence x has on mean and variance. Since you estimate all parameters, you can sample observations for any desired point of the response distribution, i.e., 5%, 50%, 95% Quantile. What you don`t get is how x affects different parts of the conditional distribution. That is where you should use Quantile Regression / Expectile Regression instead. |
Thanks for explanation @StatMixedML , I got the first part (and I think it's what I'm looking for), but not sure got the second:
I"ll try to understand better from the paper. Thanks a lot! |
|
Thank you very much for the issue and for your paper! We will implement one of the solutions in the library, because it is one of the most frequently requested features. |
|
@annaveronika: Great to hear that CatBoostLSS is getting support from the CatBoost team! Let`s get in in contact to collaborate on this! |
|
Just to be clear - we are not committing on supporting CatBoostLSS, we are planning to implement one of the solutions, not necessarily CatBoostLSS, based on some experiments from out site. We'll write all updates here. |
|
I'll remove the email from the previous msg tomorrow, so please copy it somewhere :) |
|
Sure, I do understand. I am not sure, though, how we align on that I already have a paper out + an implementation on CatBoostLSS that is submitted for publication in a refereed journal. You can find the repo here: https://github.com/StatMixedML/CatBoostLSS I think we need to align on copyrights before you start implementing a solution. Ideally, we have a co-authorship on the paper. Please let me know. |
|
For copyrights we need your agreement if we copy the code from your repo. Or if you make a pull request, then you have to agree to our CLA. I don't think there are other problems, it's not required to coauthor a paper to make contributions or to implement an idea from a public research paper. |
|
I understand. But adhering to sound scientific principles, how do we deal with the fact that I have submitted the paper to a journal? |
|
@annaveronika I'm one of the authors of ngboost- please do include our approach in any internal benchmarking you do. We'd love to see the results and are happy to answer any questions. @StatMixedML thanks for giving me a heads up about this conversation! |
|
I am curious if there is any update on adding distributional support to Catboost, whether via an NGBoost-type approach or other. This would be a huge feature addition. Thanks. |
|
Any update on this? It's an important issue for us and I already know of 3 separate organizations that had to implement NGBoost-type approaches on forks with duct tape. |
|
Hello! We implemented RMSEWithUncertainty loss and Uncertainty prediction, I think this is what you are looking for https://catboost.ai/docs/references/uncertainty.html#uncertainty |
The problem:
I'm looking to emit prediction intervals for each predicted value (the mean) in regression. I need that these intervals cover say 90% of true values and be as narrow as possible. In other words I want to learn and emit variance (or noise) which can't be explained by features of the model in each region of data - each sample would have different intervals determined by input vector.
For example:
Predicting income by number of education years. Given there is no additional data we have I would expect lower variance of income for lower education and higher variance for higher education. Another example - predicting how much years left to leave, by age and health data of a person. Young would have larger variance, while old lower, and old and unhealthy even more lower.
There are two main methods I'm aware of to do it:
The question:
As mentioned I want the interval be as narrow as possible but still satisfy the needed coverage, which means learning separate models for quantiles or parameters for parametric methods wouldn't provide optimal solution in terms of coverage and width.
I'm looking for the loss function which can optimize two things simultaneously. Is there something builtin already in some library and if not what would be the simplest way to implement it?
Both parametric and non parametric methods are accepted.
Thanks in advance!
Alexander
Example
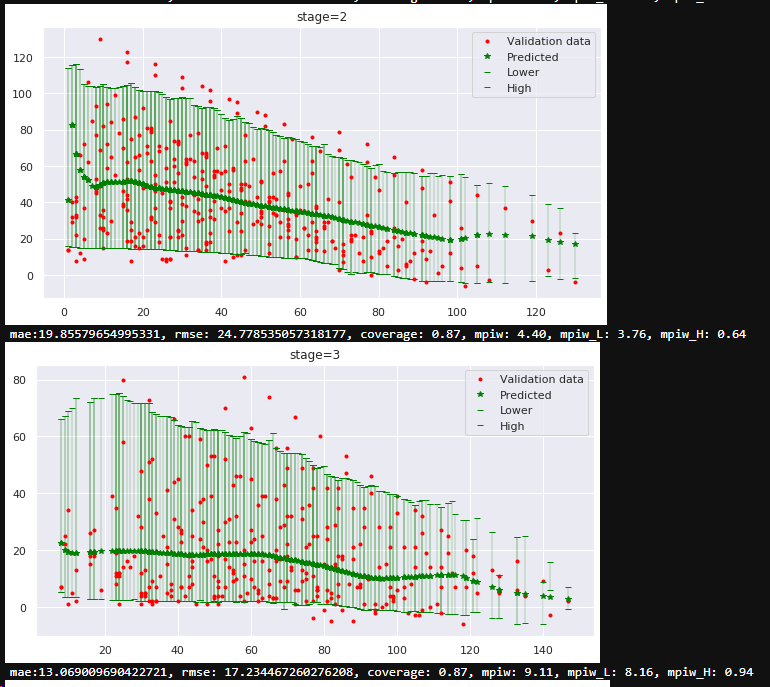
The data in example is simulated: 2 independent variables - stage (categorical) and age (axis X), axis Y is the predicted value. The bounds and mean created by 3 separate quantile models. But real data is much more complex, so separate models approach not creating nice results.
The text was updated successfully, but these errors were encountered: