Skip to content
New issue

Have a question about this project? Sign up for a free GitHub account to open an issue and contact its maintainers and the community.

By clicking “Sign up for GitHub”, you agree to our terms of service and privacy statement. We’ll occasionally send you account related emails.

Already on GitHub? Sign in to your account

[RobertaForSequenceClassification] RAM memory leaks during retrieving word attributions #78

Open
roma-glushko opened this issue Feb 15, 2022 · 8 comments
Assignees
Labels
bug Something isn't working enhancement New feature or request

Comments

@roma-glushko
Copy link

Hi folks,

I'm experiencing some memory leaks when using the Transformers Interpret (TI) library which triggers out of memory errors and kills the model service process.

Setup

Here is how the TI lib is being using (roughly):

class NLPModel:
    """
    NLP Classification Model
    """

    def __init__(self):

        self.label_encoder: LabelEncoder = joblib.load(
           ...
        )
        self.tokenizer = AutoTokenizer.from_pretrained(
            ...
            padding="max_length",
            truncation=True,
        )

        self.model: "RobertaForSequenceClassification" = AutoModelForSequenceClassification.from_pretrained(
           ..., num_labels=self.num_classes
        )

        self.classifier = pipeline(
            "text-classification", model=self.model, tokenizer=self.tokenizer, return_all_scores=True
        )

        self.explainer = SequenceClassificationExplainer(self.model, self.tokenizer) # the TI library

    def get_word_attributions(self, agent_notes: str) -> List[WordAttribution]:
        """
        Retrieves attributions for each word based on the model explainer
        """

        with torch.no_grad():
            raw_word_attributions: List[RawWordAttribution] = self.explainer(agent_notes)[1:-1] 

        # some post processing of the raw_word_attributions
        # return processed word attributions

model = NLPModel()

def get_model() -> NLPModel:
     return model

The code is running as a FastAPI view with one server worker:

app = FastAPI()
router = APIRouter(prefix=URL_PREFIX)

# some views

@router.post("/predict/")
def get_predictions(payload: PredictionPayload, model: NLPModel = Depends(get_model)):
    samples = payload.samples
    predictions = model.predict(...)  # regular forward pass on the roberta classification model
    response: List[dict] = []

    for sample, prediction in zip(samples, predictions):
        word_attributions = model.get_word_attributions(sample.text)

        response.append(
            {
                # .... some other information
                "predictions": prediction,
                "word_attributions": [attribution.dict() for attribution in word_attributions],
            }
        )

    return JSONResponse(content=jsonable_encoder(response))

app.include_router(router)
uvicorn main:app --workers 1 --host 0.0.0.0 --port 8080 --log-level debug

The whole service is running on CPU/RAM, no GPU/CUDA is available.

Problem

Now when I start to send sequential requests to the service, it allocates more and more memory after each of the request. Eventually this leads to OOM errors and the server gets killed by the system.

Memory allocation roughly looks like this (these statistics I have collected on my local docker environment where I have 6 GB RAM limit):
Screen Shot 2022-02-15 at 16 39 58

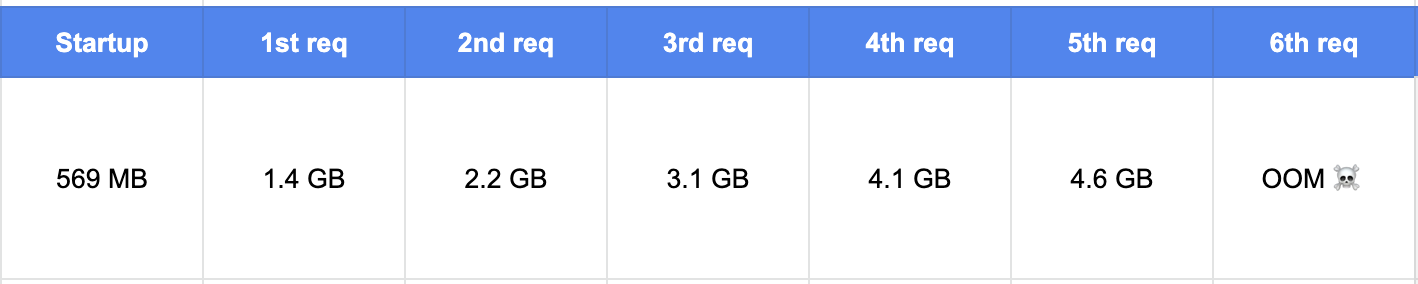
Using empirical experiments, I was able to define that problem lays in the following line:

raw_word_attributions: List[RawWordAttribution] = self.explainer(agent_notes)[1:-1] 

When I disabled the line, the service used not more than 500-700MB and the memory consumption almost stayed the same.

Now from what I understand the TI library calculates gradients in order to identify word attributions. I suspect that this is the reason of the issue. However, using zero_grad() on the whole model did not help me to clean up RAM. I have tried more tricks like forcing GC collection, removing the explainer and model instances but non of the things really helped.

Do you have any ideas how could I clean up RAM that the service uses after running the Transformers Interpret library?

Appreciate your help 🙏

@roma-glushko
Copy link
Author

Hi @cdpierse 👋 do you know what could be the workaround here?

@cdpierse
Copy link
Owner

cdpierse commented Feb 15, 2022

Hi @roma-glushko,

Thanks for using the package and for such a detailed overview of the issue you are running into. I think I have a fix for it.

It's not well documented yet (which I must do) but in one of the more recent releases, I added a new feature to control the internal batch size that is passed when calculating the attributions. By default, the example text and every n_steps used to approximate the attributions are all calculated at once. This is available for every explainer and future explainers.

However, if you pass in internal_batch_size into the explainer objects' callable method it should give you some fine-grained control over this. So for your example, it might look something like:

# find a batch size number that works for you, smaller batch will result in slower calculation times
self.explainer(agent_notes, internal_batch_size=2)[1:-1] 

I actually ran into this same issue myself with a demo app on streamlit that had very limited RAM I did the internal batch size trick there too and it worked really well.

You are totally correct btw as to why this is happening. Gradients are calculated for n_steps which by default is 50. So if the internal batch size is not specified that means 50 sets of gradients will be stored in RAM all at once, which for larger models like Roberta starts to become a problem. Using the internal batch size helps us to do this piece by piece in a more manageable way.

I hope this helps, do let me know how you get on.

@roma-glushko
Copy link
Author

Hi @cdpierse Charles, thank you for the swift response 👍

The internal_batch_size does help a bit, but I believe we are talking about two different issues.
The internal_batch_size argument seems to constraint the peak RAM usage during the gradient calculations. This is great for environments with the limited resources. However, unfortunately it doesn't fix the issue with RAM leaks. The memory keeps leaking, but with the slower pace. It was sufficient for the Streamlit app because Streamlit reloads the whole script each time we change any UI controls (AFAIK). That seemed to clean up leaked memory naturally and the application stayed resilient.

In case of serving an application via conventional web frameworks (like FastAPI, Flask, etc), they don't restart the whole application over and over again, so the leaked memory is not cleared up like it happened in the Streamlit case. As a result, the application is going to run out of memory no matter how many we are ready to give it.

Could be so that we are missing detach() call somewhere in the process of attribution calculation, so the the full gradient graph accumulates like a snowflake over the time?

@roma-glushko
Copy link
Author

Alright, I think it also makes sense to create an issue in Captum repository: pytorch/captum#866

@cdpierse
Copy link
Owner

Hi @roma-glushko,

Thanks for looking into this further. I think you're right regarding the issue, I ran a long-running process locally and noticed a gradual memory increase regardless of batch size. I also tried experimenting with zeroing the gradients on the model but it doesn't seem to work. Most likely it's as you say that the n_steps gradients accumulated throughout the process are to blame.

I'll keep trying to debug a bit on my side to see if there is a way for me to force accumulation to be dropped. It might be on Captums' side too so I'll take a look at that too and see if I can up with a PR.

Will keep you posted!

@cdpierse cdpierse self-assigned this Feb 17, 2022
@cdpierse cdpierse added bug Something isn't working enhancement New feature or request labels Feb 17, 2022
@roma-glushko
Copy link
Author

roma-glushko commented Feb 21, 2022

Hi @cdpierse, Thank you for keeping investigation in this task 🙏

experimenting with zeroing the gradients on the model but it doesn't seem to work

Yeah, can confirm it did not work for me neither.

Please let me know if I can help somehow with this issue. I would love to but I have already ran out of ideas how to track this issue down.

@cdpierse
Copy link
Owner

cdpierse commented Mar 7, 2022

Hi @roma-glushko was just thinking about this issue again and was wondering in your tests of you had tried doing a loop of inferences on the model itself without the explainer, trying to isolate where the leak is. Iirc Pytorch models should be stateless with each new forward pass, so it must likely be with the explainer.

@roma-glushko
Copy link
Author

Hi @cdpierse,

you had tried doing a loop of inferences on the model itself without the explainer, trying to isolate where the leak is

Yes, I have tried to comment out the explainer part and the pytorch inference itself seemed to be stable in terms of RAM usage. So yeah, I can confirm that results of my tests pointed to the explainer code. However, it was not clear what exactly the issue in the explainer iteself nor in captum lib.

Sign up for free to join this conversation on GitHub. Already have an account? Sign in to comment
Labels
bug Something isn't working enhancement New feature or request
Projects
None yet
Development

No branches or pull requests

2 participants