Top of negative bar renders over zero line #6000
Labels
Comments
|
This is a bit different in |
|
Tested master and now the red line is missing on the positive bar https://jsfiddle.net/pqfdrvz3/ |
|
dpr: 1 dpr: 1.25 dpr: 2.5 |


Sign up for free
to join this conversation on GitHub.
Already have an account?
Sign in to comment
Expected Behavior
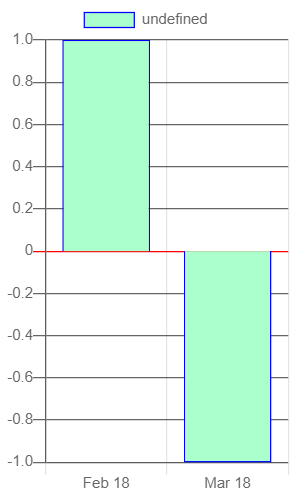
A bar is expected to have the zero-line as one of the borders
Current Behavior
Bars with negative values start from the zero-line, rather than below it, meaning they lack the top border.
Steps to Reproduce (for bugs)
https://jsfiddle.net/winter_limelight/zxd0b81c/9/
Note that the red line is absent from the Mar 18 bar.
Setting maintainAspectRatio: true changes the border behaviour, but doesn't fix the issue.
Context
Presently trying to create chart showing historical +ve/-ve percentage changes for a client.
Environment
Chart.js version: 2.7.3
Browser name and version: Noted in Chrome 71, Firefox 64.
The text was updated successfully, but these errors were encountered: