A list of tools to help debugging issues or simply check what's going on in the system.
Linux is assumed. On OSX, options can be way different.
top cw: something's taking up all the cpu or mem ?htop: a colorful top, easy to play withps fauxww: list of all processes with command line + hierarchyfree -h: memory and swapdf -h: mount pointsiptables -L -v: firewall rulesdmesg -T: kernel messages. Can be fulfilled of iptables denied message :-) or other useful stuff to check in case of problemsenv: list the environment variablesuptime: checkout 1min/5min/15min load averagestrace: trace system calls and signals a program does (file open, read, stat, mmap, ...).strace -e open uptime 2>&1lsof: list opened files (and sockets):lsof -i -n -p: sockets,lsof /varwhich processes is opening files in/varlsblk: list info about block devices, useful to see disk not mount but handled differentlyping -c 1 $(ifconfig | grep broadcast | cut -d' ' -f6) && arp -a: ping the broadcast address to list network connected devices
List of tools used to look after system performances (mem, cpu, disks, network, processes, files..) :
- sysdig : a console ui to monitor (live and snapshots) several aspects of the system
sudo sysdig 'proc.name=java' -w ~/sysdig.scap - iostat : i/o accesses
iostat -m -x -d 2 - ioping : test disks latency
ioping -c 10 .and iops:ioping -R .or-RLfor sequential - vmstat : mem/swap/cpu
vmstat 1 - mpstat : check the stats for each cores, useful to spot single-threaded apps (if unbalanced)
mpstat -P ALL 1 - ifstat : like iostat, vmstat, but for network interfaces
- netstat : details about all the network connections of the system
netstat -putel.netstat -anr - ss : an easier netstat?
ss -nlts src :10010or more explicitss -n4lt '(sport = :5000 or dport = :5000)'(numeric, listen, tcp, summary ipv4) Useful to look at send/receive tcp/udp queues (can indicate congestion) - ss : a bit like netstat, list all sockets (tcp/udp), their state
ss -ta(TCP, all) - dstat : *stat all-in-one
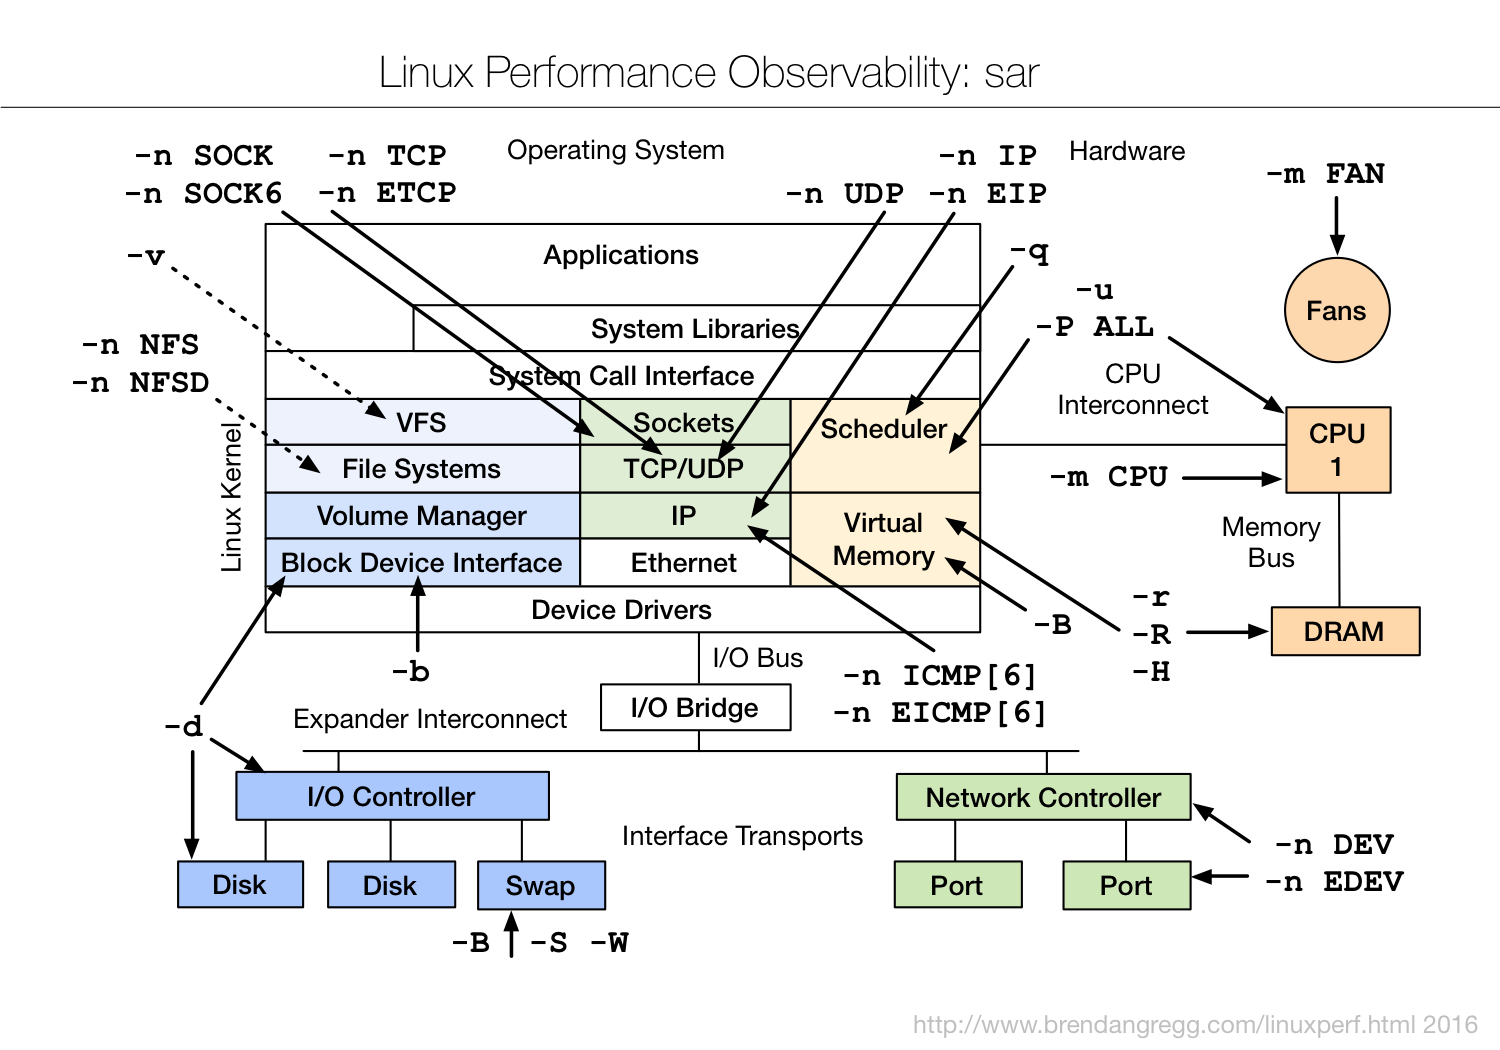
- sar : monitor network, devices
sar -n DEV 2All commands in a nice pic: http://www.brendangregg.com/Perf/linux_observability_sar.png - iotop : top, with i/o !
- iperf : test maximum bandwidth (tcp/udp)
iperf -c server -f m -d - netperf: in the same vein, more complete
- ulimit: memory, open files, and misc size limits for the user (often, the open file limit must be raised if the server contains hot apps)
ulimit -n 2000000(open file descriptors)
Another repo with great scripts using ftrace under the hood: https://github.com/brendangregg/perf-tools
- dig: query dns servers
dig +short github.comdig +nocmd github.com any +multiline +noall +answer - traceroute: measure and display packets' routes to any host across a network. This website is nice to test from multiple locations around the world: http://mtr.guru/
- host: resolve dns/ip
host -t ANY github.com - lnstat: network stats (arp cache, route cache, nf and ip conntrack entries..):
lnstat -j - conntrack: Connection tracking
conntrack -C: how many connections in the table - nmap: The famous tool to know which ports are opened:
nmap -sT -vv -p 1-65535 [ip] - tcpdump: listen to what's going on on the network interfaces:
tcpdump -i lo -A dst port 8080(-Afor ascii, eg: for HTTP) - tshark: a "better" tcpdump which understands protocols
- ngrep: a simpler? tcpdump with grep features! can listen to specific or all interfaces, given port, and match patterns.
$ ngrep -d any "Value" port 2003
interface: any
filter: (ip or ip6) and ( port 2003 )
match: Value
####
T 172.17.0.1:54820 -> 172.17.0.2:2003 [AP]
  com.ctheu.test.Value 42 1486331086.
For HTTP requests, it's better to use:
ngrep -d any -q port 8081 -W byline
To monitor multicast:
ngrep -q -W byline '' multicast
- hdparm : check drives settings
hdparm -Tt /dev/sda8 - ethtool : check the ethernet cards settings (speed, duplex etc. if you have a doubt)
ethtool eth0
- lstopo: a wonderful tool to draw the topology of the server (show cpus, their caches, the physical sockets, the memory) into a nice big picture
lstopo --output-format txt -v
A tons of good links and presentations here: http://www.brendangregg.com/linuxperf.html.
- jstat : like iostat, vmstat, for java processes
jstat -gc -t -h30 [vmid] 1s : monitor Java GC - jvisualvm : packaged with java, ultra useful
- jmc : Java Mission Control. A better jvisualvm
/proc/sys/vm/vfs_cache_pressure/proc/sys/vm/swappiness/proc/sys/vm/zone_reclaim_mode(Disable NUMA)
cat /proc/cpuinfo: list of cpus of the system with details (type, MHz, cache size..)lscpu: shorter/proc/sys/fs/nr_open: hard limit of the current number of file handles the kernel can handle/proc/sys/fs/file-max: current number of file handles the kernel can handle/proc/sys/fs/file-nr: file handles currently opened/used file handles/the max (= file-max)/proc/sys/vm/nr_hugepages: map huge memory pages (if using Java with a big heap, set also +UseLargePages)
sysctl can be used to change the values: sysctl -w fs.file-max=786046. Or /etc/sysctl.conf.
Enable BBR algorithm for TCP: sysctl -w net.ipv4.tcp_congestion_control=bbr to get better throughput when congestion occurs.
And probably sysctl -w net.core.default_qdisc=fq with that.
Flags I grab here and there, not optimal or anything, just to know they exist.
net.ipv4.tcp_slow_start_after_idle = 0for long TCP connection, avoid slow start once againnet.core.netdev_max_backlog = 5000net.ipv4.tcp_no_metrics_save = 1net.ipv4.tcp_sack = 1net.ipv4.tcp_timestamps = 1net.ipv4.tcp_window_scaling = 1net.core.wmem_max = 12582912net.core.rmem_max = 12582912net.ipv4.tcp_rmem = 10240 87380 12582912(tcp receive buffer thresholds)net.ipv4.tcp_wmem = 10240 87380 12582912(tcp sendbuffer buffer thresholds)net.ipv4.tcp_mem = 10000000 10000000 10000000(tcp memory autotuning, define low/middle/max thresholds)
https://wwwx.cs.unc.edu/~sparkst/howto/network_tuning.php
- nf_conntrack can be very important too
sysctl -w fs.file-max="9999999"
sysctl -w fs.nr_open="9999999"
sysctl -w net.core.netdev_max_backlog="4096"
sysctl -w net.core.rmem_max="16777216"
sysctl -w net.core.somaxconn="65535"
sysctl -w net.core.wmem_max="16777216"
sysctl -w net.ipv4.ip_local_port_range="1025       65535"
sysctl -w net.ipv4.tcp_fin_timeout="30"
sysctl -w net.ipv4.tcp_keepalive_time="30"
sysctl -w net.ipv4.tcp_max_syn_backlog="20480"
sysctl -w net.ipv4.tcp_max_tw_buckets="400000"
sysctl -w net.ipv4.tcp_no_metrics_save="1"
sysctl -w net.ipv4.tcp_syn_retries="2"
sysctl -w net.ipv4.tcp_synack_retries="2"
sysctl -w net.ipv4.tcp_tw_recycle="1"
sysctl -w net.ipv4.tcp_tw_reuse="1"
sysctl -w vm.min_free_kbytes="65536"
sysctl -w vm.overcommit_memory="1"
sysctl -w net.ipv4.tcp_slow_start_after_idle="0"
ulimit -n 9999999
net.ipv4.ip_local_port_range = 18000    65535
net.ipv4.netfilter.ip_conntrack_tcp_timeout_time_wait = 1
http://www.lognormal.com/blog/2012/09/27/linux-tcpip-tuning/
Size of the conntrack table:sysctl net.netfilter.nf_conntrack_count (the limit being sysctl net.nf_conntrack_max)
See lnstat -j
To do some testing, it's possible to alter the quality of the network traffic:
tc qdisc add dev wlan0 root netem loss 10%tc qdisc add dev eth0 root netem delay 80ms 15ms distribution normal