11th January 2024 to unlimited, United Kingdom fully-automated runs for validation purposes only ('anomaly' and 'monthly-centiles')
Open to requests from strategic partners experienced in large language models (LLMs), contract work, technology sale -> re-climate.earth

See Example Requests and Limitations
The Re-Climate® API delivers reliable seasonal climate predictions to operations teams in the agri-food, energy and water utilities, and insurance industries. These forecasts have been independently and impartially assessed by the National Physical Laboratory.
The company combines climate and weather models through its algorithms; helping organisations to adapt to near-term climate hazards, calculate their risk exposure and build their resilience accordingly.
Modelling seasonal weather extremes assists decision-makers communicate losses linked to floods, drought, wind damage, hail, heatwaves or freeze days to within a few kilometres.
Supplied as an 'ensemble', a collection of well-calibrated daily weather time series, Re-Climate® enables firms to better hedge or price their risk. Re-Climate® also helps clients adapt to acute physical risks posed by extreme weather events such as heatwaves and floods, develop rigorous scenario plans, and protect assets from acute climate hazards on operational timescales.
WeatherLogistics has a mission to help meet UN Sustainable Development Goals (SDGs) for food, water and natural resources. Currently the firm is developing a sustainability monitoring platform to advise farmers on their present and future climate exposure and how to reduce both their agricultural inputs and reduce greenhouse gas emissions. This forms part of a 12-month project in partnership with the University of Leicester, the University of Reading and supported and funded by UKRI/ STFC.
Future farmers will be able to build smarter precision farming solutions and benchmarking platforms, integrated pest management systems, and decision-support applications to avoid food supply distribution. Growers can also optimise their operations with better timed preventative spraying, frost protection, and crop quality assurance.
To get started, please request an API authentication key and user credentials from the product owner. To make single requests the API-Request.py script should be used, while for multiple requests please see API-Request-Multithreading.py. The Python code can be used to access six main data streams, with post-processing code also supplied to calculate return periods and other statistics from daily town and city data supplied through "Daily Ensembles". For a description of all available API requests, please see API_requests.md.
To get started with the API request code, first specify the endpoint URL for the relevant Re-Climate® API.
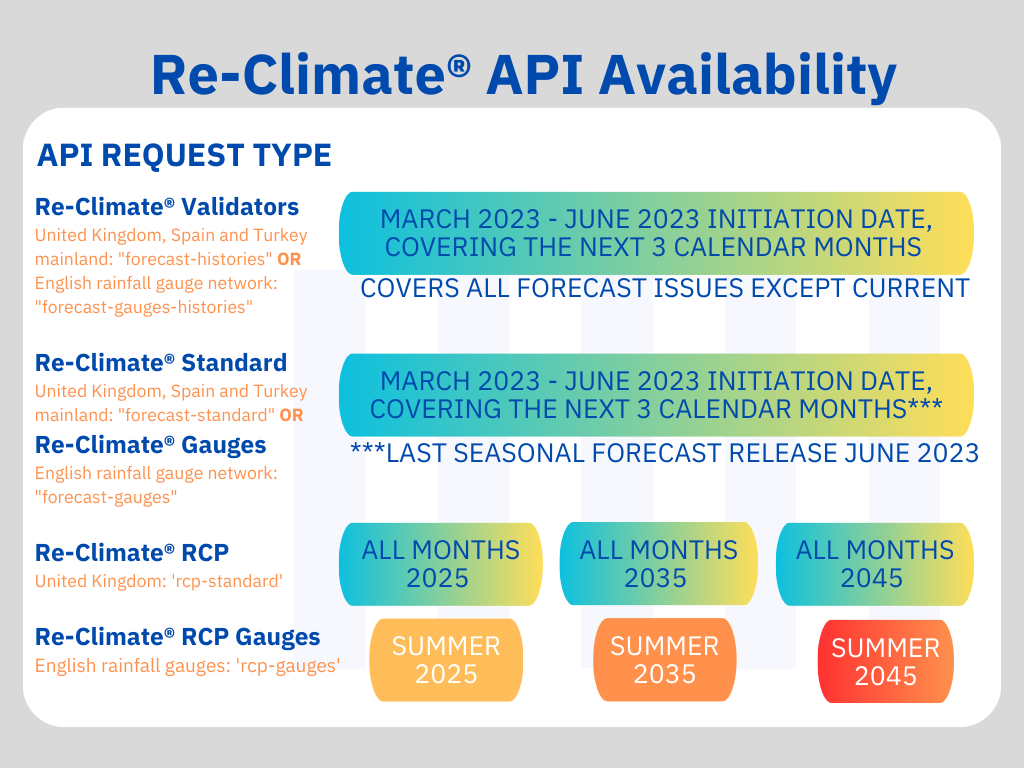
- Re-Climate® Validators, historic seasonal forecasts (except current issue)
- Re-Climate® Standard, seasonal forecasts for towns and cities
- Re-Climate® Gauges, seasonal forecasts at UK rain gauge sites
- Re-Climate® RCP Projections, downloadable for free
Independently and impartially assessed by the National Physical Laboratory, Re-Climate® delivers forecasts of climate perils covering the next 3 months and at a 5 kilometre resolution to prepare for extended weather hazards. For more information on the seasonal climate forecast services please see WeatherLogistics' Docs.
The Re-Climate API ...:
- Builds on 9-years of R&D in seasonal climate prediction science
- Combines state-of-the-art models with statistical post-processing
- Simulates daily precipitation event generation to manage local flood/ drought
- Delivers reliable weather hazard analytics to assess daily events
- Extends deterministic weather predictions from 2 to 15 weeks
- Provides access for historical start dates from month: '03', year: '2023'
- Updates climate hazard information on the 11th day of each month
- UK: 49.84° to 60.85° North, -10.7° to 2.69° East
- Spain: 35.71° to 44.17° North, -9.67° to 3.67° East
- Turkey: 35.82° to 42.14° North, 26.04° to 44.79° East
*USA is in our future development pipeline, expanding to other geographies
WeatherLogistics completed a successful collaboration with the National Physical Laboratory (NPL) in April 2022. As part of its deliverable, NPL validated its short-term climate forecasts and provided a statistical framework for quality assessment of probabilistic weather predictions. WeatherLogistics used these techniques to ensure the reliability of its Re-Climate® APIs.
NPL's validation report presents a comparison of the predicted frequencies of occurrence of daily precipitation events of different intensities against ERA5-land measurements. Covering 96 UK cities for the years 2018 to 2022, the results summarise the late winter assessment from January to March period (lead times of 1 to 3 months) as they would be issued on 10th December.
Similarly, NPL’s report also provided direct comparisons for the late summer period as issued on 10th June, which cover the months July to September from 2018 to 2022. For both the winter and summer the results demonstrate a good overall seasonal consistency between observations and WeatherLogistics' retrospective seasonal climate predictions at the city scale.

NWP = Numerical Weather Prediction
**Country-wide ASCII grid provided at a monthly granularity, useful for a big-picture seasonal overview
Monthly centile data supplies users with mapped averages of precipitation in addition to minimum, maximum and average monthly temperatures. At present these are available for the mainland geographical area of the United Kingdom, Spain and Turkey. These ASCII grids present the lower to upper thresholds in the respectively meteorological variables at the 10th, 30th, median (50th), 70th and 90th centile confidence bounds. Since the seasonal climate forecasts provide well-calibrated information, 8 in 10 months are likely to present monthly conditions between the 10th and 90th centiles at any specified geographical location.
To request this climate data on a regular 5km grid, see monthly centile request example input. See further documentation and ASCII formatting. To visualise ASCII output data please see Visualise_ASCII.py.
**Unique access to 100 daily simulations at the town/ city level, ideal for those with assets at specified locations
WeatherLogistics' daily ensembles provide a Quickstart framework to calculate frequencies of occurrence, threshold or centile-based exceedance calculations, consecutive day counts or accumulations; and generate customised metrics.
Ensemble members 1 to 50 are generated using WeatherLogistics' statistical forecast system, while members 51 to 100 are generated using a multi-model average of modified Copernicus Climate Change Service (C3S) seasonal forecast model data*. Both systems have been developed to achieve the best-on-market accuracy and reliability and have been independently and impartially reviewed by the National Physical Laboratory.
To request this climate data, see daily ensembles example input, and its postprocessing scripts provided for CSV and JSON inputs. See further documentation.
Using "JSON_Postprocessing.py" to calculate the 90th centile of ensemble members with consecutive dry days, where 24-hour accumulated precipitation is less than 1mm
Mean consecutive days with an event intensity equal to or below 1.0 is 13.67, which is based on analysis of 50 ensemble members and 31 days in July
Using "CSV_Postproccessing.py" to calculate an ensemble average of consecutive days of tropical nights (Tmin > 20°C), for the multi-model benchmark/ numerical weather prediction models
Mean consecutive days with an event intensity equal to or above 20 is 1.0, which is based on analysis of 50 ensemble members and 31 days in July
**Mapped country-wide town/ city indices, useful for a snapshot overview of acute seasonal climate hazards
Please view more detailed information about how to interpret seasonal climate forecast hazards, which explains: what is meant by forecast reliability, how an ensemble prediction can extend short-term forecasts without breaching mathematical constraints, what is possible from a seasonal precipitation forecast, and how to interpret the seasonal climate forecast hazards. Forecast graphics then show how information is combined from probabilistic forecasts as single value hazard indices.
Hazard indices are based on a shift-of-the-tail approach that compares daily distribution to a baseline climatology. Climate hazards indices include precipitation, drought, SPI, aridity, heat, cold, hail, minimum and maximum relative humidity, incoming solar radiation and wind speeds. These are scaled from 1 - 9, with the extremes in the index indicating probability shifted by 4 deciles below or above its local climatology reference, with 5 indicating the forecast is on par with baseline climate expectations for the current forecast month or season. To request this climate data, see hazard indices example input. See further documentation.
| Geography/ Country |
Meteorological Variable |
Reference Product |
Resolution | Start Year | End Year | Reference Midpoint |
Reference Documentation |
|---|---|---|---|---|---|---|---|
| ALL GEOGRAPHIES | precipitation, drought, SPI, aridity, heat, cold | UERRA (MESCAN-SURFEX) | 5.5km | 2004 | 2018 | 2011 | UERRA MESCAN-SURFEX |
| ALL GEOGRAPHIES | heat, cold, hail, minimum and maximum humidity, incoming solar radiation and wind speeds | ECMWF ReAnalysis v5 | 31km | 1981 | 2019 | 2000 | ERA5 |
**Country-wide ASCII grid/ town or city CSV provided at a monthly granularity; a departure forecast useful for a big-picture seasonal overview
Like the monthly forecasts request, anomalies provide a country-wide mapped overview of departures from a climatological average to assess whether the seasonal forecast period is likely to be warmer/ cooler or wetter/ drier than the average monthly conditions over the most recent years. To request this climate data on a regular 5km grid, see anomalies example input. See further documentation. To visualise ASCII output data please see Visualise_ASCII.py.
Temperature (TMean) as an absolute difference from current estimated climate conditions in Kelvin
Precipitation as an relative % of climatological reference conditions, where 100% indicates near normal conditions relative to history
| Geography/ Country |
Meteorological Variable |
Reference Product |
Resolution | Start Year | End Year | Reference Midpoint |
Reference Documentation |
|---|---|---|---|---|---|---|---|
| United Kingdom | Monthly Temperature (TMean) | UKCP09 | 5km | 1962 | 2016 | ADJUSTED TO CURRENT | Hadley Centre |
| United Kingdom | Monthly Precipitation (precipitation) | UKCP09 | 5km | 1962 | 2016 | ADJUSTED TO CURRENT | Hadley Centre |
| Spain | Monthly Temperature (TMean) | SPREAD | 5km | 1962 | 2014 | ADJUSTED TO CURRENT | STEAD |
| Spain | Monthly Precipitation (precipitation) | SPREAD | 5km | 1962 | 2013 | ADJUSTED TO CURRENT | SPREAD |
| Turkey | Monthly Temperature (TMean) | UERRA | 5km | 1961 | 2017 | ADJUSTED TO CURRENT | ECMWF-UERRA |
| Turkey | Monthly Precipitation (precipitation) | UERRA | 5km | 1962 | 2015 | ADJUSTED TO CURRENT | ECMWF-UERRA |
ADJUSTED TO CURRENT Chronic climate change adjustments are applied using a monthly temperature trend adjustment on an individual gridcell basis. This shifts the reference midpoint climate to present day.
November precipitation anomalies plotted using Re-Climate® data issued on 10th October 2022.


**Access to figures showing town/ city daily weather profiles at quantile (decile) intervals for the upcoming season, ideal for who need a quick snapshot view
Comparisons between the seasonal profile (centile distributions) of daily temperature and precipitation plotted at each decile, compared directly to the 4.5km Europen UERRA Re-Analysis climatology from 2004 to 2018. To request this climate data for a specified town or city, see daily quantiles (Q-Q) example input.
**Access to figures showing town/ city daily weather ensemble summaries as box-whisker/ violin plots for the upcoming season, ideal for who need a quick snapshot view
Comparisons between the seasonal profile (centile distributions) of multiple meteorological variables, compared against WeatherLogistics' real-time equivalent model climatology. To request this climate data for a specified town or city, see graphical summaries example input.
Example below (top), showing daily minimum temperatures from all 100 ensemble members for central London for the mid-autumn period. Using the "meteorological_variable": "TMin" option.


Monitoring summer temperature extremes and heatwave extremes, July forecast issued on 10th June 2022

Monitoring summer precipitation deficits and drought conditions, July forecast issued on 10th June 2022

Volumetric soil moisture content forecast (layer 2, 7cm to 28cm) for May 2023, showing five centiles (10th, 30th, median, 70th and 90th) intervals of the seasonal climate forecast.

WeatherLogistics® is an innovative climate technology company with 10-years expertise in improving the value of seasonal climate forecasts for operational use.
The company’s successful projects include a European Space Agency kick-start activity. WeatherLogistics® has also undertaken data validation and meteorological product audits for the agricultural industry. Its clients include renewable energy, water management and insurance firms. Delivered through the Google Cloud Platform, its extended precipitation data offers the most detailed information available to support operations teams in Turkey and the UK impacted by drought.
WeatherLogistics' codebase has been verified by the Science & Technology Facilities Council and its results validated by data specialists at Agrimetrics. Independent and impartial validation was also undertaken by NPL funded through UKRI/ A4I programme. WeatherLogistics also helped initiate and sponsor Yield21 ‘Predict Our Harvest’ and is also a UKRI/ NERC project partner for Seasonal Weather Prediction.
*Contains modified Copernicus Climate Change Service information 2022. Neither the European Commission nor ECMWF is responsible for any use that may be made of the Copernicus information or data it contains.