User Guide
- Introduction
- Installation
- Creating a Project
- Connect Your Application to Code Pulse
- Viewing a Trace
- Identifying a Web Application Attack Surface
- Managing Projects
- Running Multiple Code Pulse Instances
- Removing Code Pulse
- Viewing Code Pulse Logs
Code Pulse is a real-time code coverage tool that runs on Windows, macOS, and Linux. It includes agent programs for Java and .NET that monitor your application to track code coverage details at the method or source code level so that it can show you what's being called and when. Code Pulse currently supports Java programs up to Java 11, and .NET Framework programs for CLR versions 2 and 4.
"Tracing" refers to using a Code Pulse agent, or tracer, to observe activity within your application. During tracing, the agent gathers the code coverage activity it discovers and sends it to the Code Pulse application where you can view the coverage details using the Code Treemap and Source Code Viewer.
Once you have completed the Code Pulse software installation, starting your first trace requires two steps:
-
Create a project in Code Pulse - this lets Code Pulse figure out what it needs to know about your application, and how to represent it to you.
-
Connect your application to Code Pulse - this attaches a Code Pulse agent to your application, making code coverage data available to you in Code Pulse.
You can then use your application as you usually would and view the tracing results in Code Pulse.
The Code Pulse software consists of two parts: the Code Pulse application and the Code Pulse trace agents. The Code Pulse application and the Java trace agent run on Windows, macOS, and Linux. The .NET Framework agent runs on Windows only.
Code Pulse provides backward compatibility with previous Code Pulse versions by allowing you to import projects exported from Code Pulse 2.0 and 2.5. Before installing Code Pulse 2.6, use Code Pulse 2.0 or 2.5 to export any projects you want to load into Code Pulse 2.6.
Note: If your project was a 2.0 project, you must recreate your project if you want to use the new source code feature introduced in Code Pulse 2.5.
Code Pulse supports 64-bit versions of Windows, Linux, and macOS. The Code Pulse software is distributed as a .zip file. The Windows .zip file contains a Windows Installer component that installs Code Pulse for you.
On Windows, Code Pulse is distributed as a .zip file. Download the .zip, extract it to a folder of your choosing, and run the CodePulse.Win64.msi Windows Installer program to start the installation.
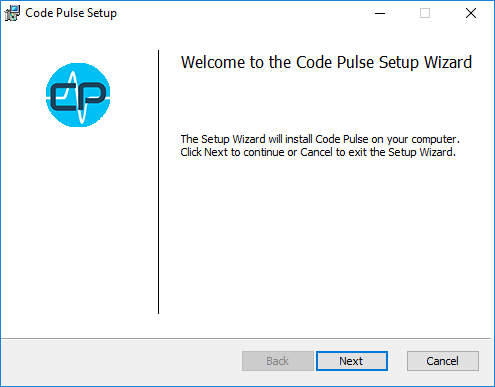
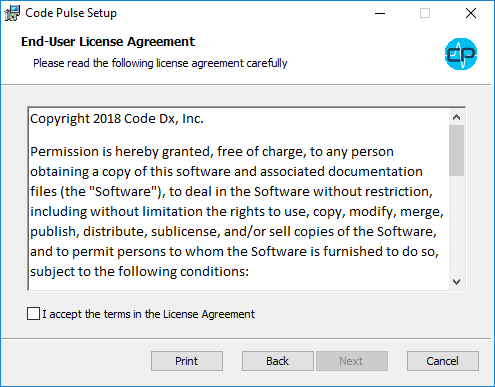
Click Next and check the box to agree to the license terms and conditions.
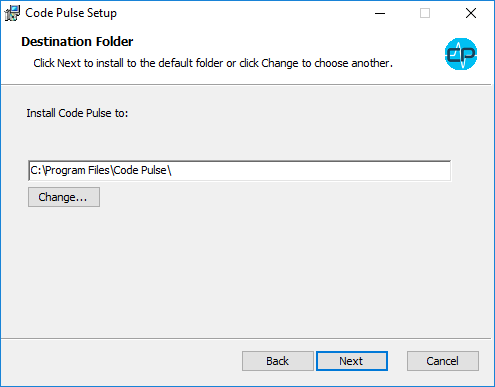
Click Next to open the Destination Folder window. By default, Code Pulse will install to the C:\Program Files\Code Pulse folder. Click Change... to select an alternate folder.
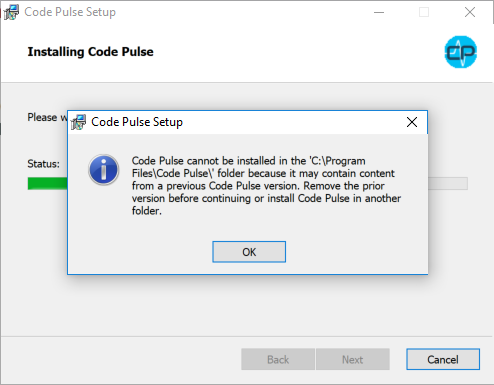
Note: The installation will abort if a previous version of Code Pulse is found in the destination folder you specify. Installing Code Pulse over a prior version may cause run-time errors, so the installer aborts if it detects an
app,backend,jre, orlocalesfolder in the destination folder.
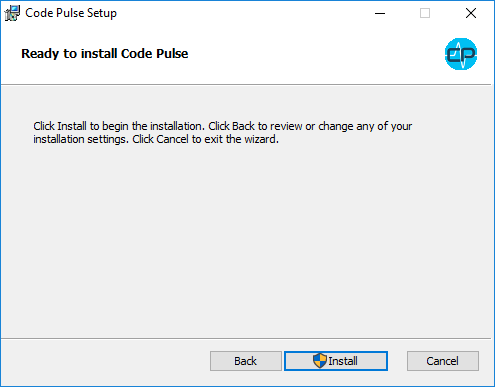
After specifying the destination folder, click Next and Install to start the installation.
The installer may prompt to run with elevated permissions. When the installation completes, you will see the "Thank you for installing Code Pulse" message shown below.
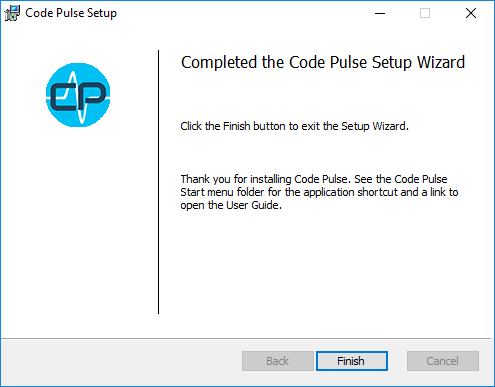
You can launch Code Pulse by finding the Code Pulse icon in the Windows Start menu. Code Pulse may take a couple of seconds to start up.
Code Pulse runs an embedded .NET Symbol Service that it uses when you upload an input file containing a .NET Framework application. The service depends on a version of .NET Core 2 that is bundled with the Code Pulse application, so you do not have to install .NET Core separately.
Note: The .NET Symbol Service uses port 49582 by default, but you can change the port by setting the SYMBOL_SERVICE_PORT environment variable before running Code Pulse.
If a problem occurs during startup, the application log might provide additional insight into the issue. To see the application log, run Code Pulse with the --log flag (e.g., C:\Program Files\Code Pulse\codepulse.exe --log) to display the log in a separate window.
Note: For more information on viewing application logs, see the Viewing Code Pulse Logs section.
On macOS, Code Pulse is distributed as a .zip file. Download the .zip, extract it to a folder of your choosing, and run the Code Pulse application. You can optionally move the application from the extracted directory to your Applications folder.
Code Pulse runs an embedded .NET Symbol Service that it uses when you upload an input file containing a .NET Framework application. The service depends on a version of .NET Core 2 that is bundled with the Code Pulse application, so you do not have to install .NET Core separately. You only have to make sure that your Mac is running a supported macOS version (refer to Prerequisites for .NET Core on macOS for details).
Note: The .NET Symbol Service uses port 49582 by default, but you can change the port by setting the SYMBOL_SERVICE_PORT environment variable before running Code Pulse.
If a problem occurs during startup, the application log might provide additional insight into the problem. To run the application from the command line, you'll need to navigate to the application folder via the command line. So, if you copied Code Pulse to the Applications folder, from Terminal do the following to display the log data in a separate window:
/Applications/Code\ Pulse.app/Contents/MacOS/nwjs --log
Note: For more information on viewing application logs, see the Viewing Code Pulse Logs section.
On Linux, Code Pulse is distributed as a .zip file. Download the .zip and extract it to a folder of your choosing.
Note: You'll need to make sure that you can run an NW.js application like codepulse. For example, after a Minimal Installation of Ubuntu 18.04, you may need to run both "sudo apt install libgconf2-4" and "sudo apt-get install libcanberra-gtk-module" before you can successfully run codepulse.
To run codepulse from the shell, you might need to add the executable flag first (chmod +x codepulse). Additionally, jre/bin/java and dotnet-symbol-service/SymbolService must also have the executable flag. Code Pulse will try to add missing executable flags for java and SymbolService, but if Code Pulse does not have write access to the files, you must add the executable flag with the chmod command (chmod +x jre/bin/java and chmod +x dotnet-symbol-service/SymbolService).
Code Pulse runs an embedded .NET Symbol Service that it uses when you upload an input file containing a .NET Framework application. The service depends on a version of .NET Core 2 that is bundled with the Code Pulse application, so you do not have to install .NET Core separately. You only have to make sure that you are running a supported Linux version (refer to Prerequisites for .NET Core on Linux for details).
Note: The .NET Symbol Service uses port 49582 by default, but you can change the port by setting the SYMBOL_SERVICE_PORT environment variable before running Code Pulse.
If a problem occurs during startup, the application log might provide additional insight into the issue. To see the application log, run Code Pulse with the --log flag (e.g., ./codepulse.exe --log) to display the log in a separate window.
Note: For more information on viewing application logs, see the Viewing Code Pulse Logs section.
This section describes how to install the Code Pulse Trace Agents. Follow these instructions before attempting to connect your application to Code Pulse.
Your Code Pulse installation comes with an agent.jar file, which is a special file that connects to your Java application, allowing it to monitor the execution of your program and communicate with Code Pulse.
The location of agent.jar depends on your operating system. On Windows, agent.jar is under the "C:\Program Files\Code Pulse\tracers\java" folder (unless you installed Code Pulse to an alternate location). On macOS and Linux, agent.jar is in the tracers/java folder of the Code Pulse package you downloaded.
Once you have located your agent.jar file, remember its location so that you can reference its path when you connect your Java application to Code Pulse.
Code Pulse supports .NET Framework tracing on Windows. Code Pulse includes a Windows Installer package to install and configure the Code Pulse .NET Tracer application, which is a special program that connects to your .NET Framework application, allowing it to monitor program execution and communicate with Code Pulse.
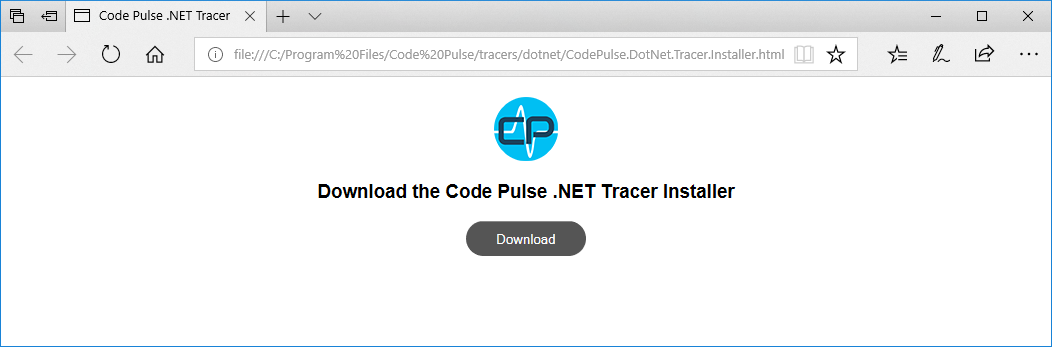
First, locate the CodePulse.DotNet.Tracer.Installer.html file. After running the Code Pulse installer on Windows, you will find the CodePulse.DotNet.Tracer.Installer.html file in the "C:\Program Files\Code Pulse\tracers\dotnet" folder (unless you installed Code Pulse to an alternate location). If you downloaded the macOS or Linux version of Code Pulse, CodePulse.DotNet.Tracer.Installer.html is in the "tracers\dotnet" folder of the Code Pulse package you downloaded.
Open CodePulse.DotNet.Tracer.Install.html and click the Download button to download the installation program.
Unzip the file you downloaded and run CodePulse.DotNet.Tracer.Installer.exe to start the installation of the 32-bit and 64-bit components of the Code Pulse .NET Tracer application. The Code Pulse .NET Tracer depends on version 4.5.2 of the .NET Framework. If your system does not support that .NET Framework version, the installer will run a .NET Framework setup program.
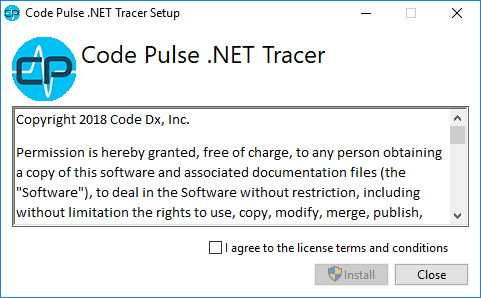
Agree to the license terms and conditions by checking the box, and then click Install. The installer may prompt to run with elevated permissions. On a 32-bit version of Windows, the installation program installs CodePulse.DotNet.Tracer.exe to the "C:\Program Files\Code Pulse .NET Tracer" folder. On a 64-bit version of Windows, the installation program installs CodePulse.DotNet.Tracer.exe to the "C:\Program Files (x86)\Code Pulse .NET Tracer" folder.
To create a project, Code Pulse needs two things; a name, and an input file.
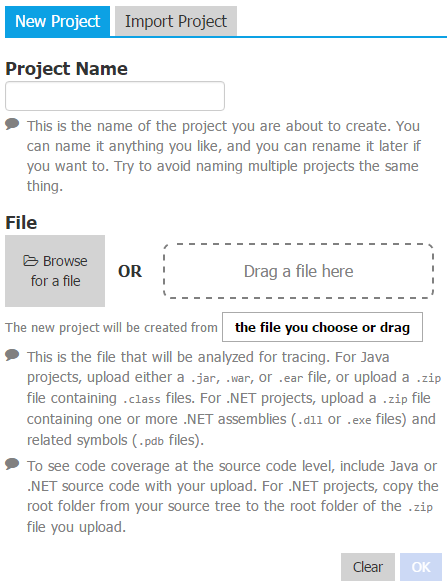
The name can be whatever you want it to be. It is simply used to help distinguish one project from another. You should try to pick different names for each project that you make. If you name everything the same thing, Code Pulse won't be confused, but you might. Don't worry about picking the perfect name up front, you can always change it later.
You package your application into an input file that you will upload to Code Pulse. Code Pulse can show code coverage at either the method level or the source code level. To see code coverage at the source code level, you must include source code in the input file. When processing an input file, Code Pulse will search for source code files and link them with related compiled code.
Code Pulse analyzes your input file searching for content it recognizes. It will create a Java Code Pulse project if its search turns up Java content such as .class files and .jsp files. When it can identify .NET content such as a .pdb file, it will create a .NET Code Pulse project. A Code Pulse project is either Java-based or .NET Framework-based. An input file containing both Java and .NET Framework content will result in a Java Code Pulse project.
For Java programs, the input file must be a Java archive (.jar, .war, .ear) or a .zip file containing at least one .class or .jsp file. Code Pulse will also search any Java archives or zip files nested in the input file. For example, a Java web application distributed as a .war file may include one or more .jar files. Code Pulse will dig into these "nested" jars during its search for .class and .jsp files.
Note: A Java input file must contain at least one
.classor.jspfile.
As Code Pulse searches nested Java archives, it may find two or more Java methods with the same package, class, and method name. When this happens, the method will appear in multiple locations within the project's application inventory. During tracing, any code coverage detected for the duplicated method will appear alongside each related application inventory item.
Note: You cannot trace a class that does not include a package name. These classes show up under in the Application Inventory.
Code Pulse supports Java JSP files and stores them separately within the application inventory. While Code Pulse can read multiple .war files contained in the input file, it can represent only one instance of each unique JSP path in the application inventory and will log a warning if duplicate JSP files are detected when parsing an input file.
Code Pulse links Java source code to compiled Java code by matching the path location of a Java source code file to the package name associated with compiled code. For example, it links a file named main.java found in the source\com\codedx\myapp folder of an uploaded archive file with the compiled Java code for type com.codedx.myapp.main. If uploading a Java archive, the main.java file can appear in any folder provided that the directory path ends with com\codedx\myapp.
Note: Code Pulse can read source code from .java and .jsp files.
For .NET programs, upload a .zip file containing .NET assembly files (.dll/.exe) and related symbol files (.pdb).
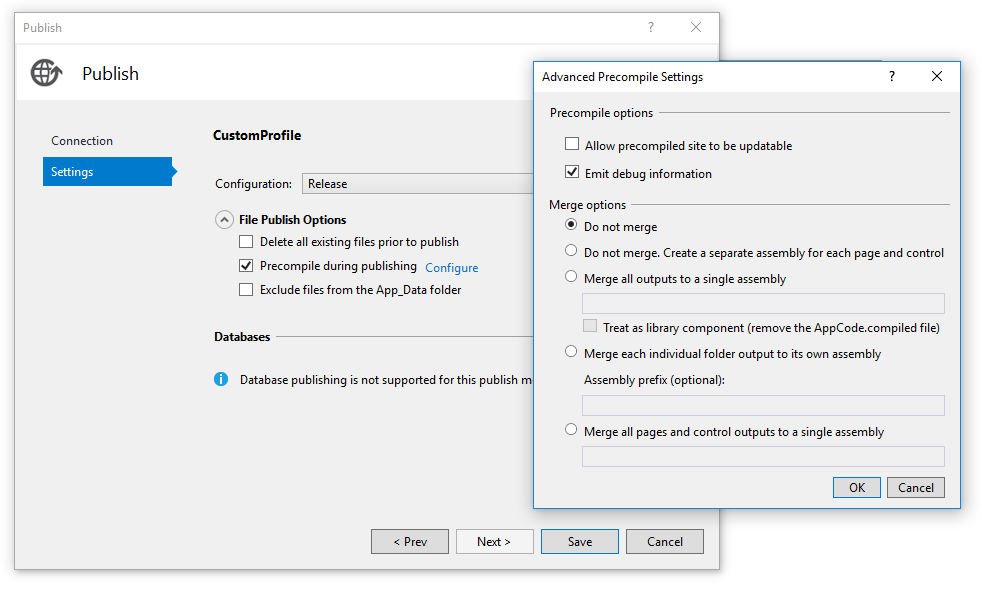
Code Pulse discovers compiled code in the input file when it establishes a new project. Some applications may generate compiled code at run-time or may use libraries that generate code at run-time. For example, Code Pulse will not discover the compiled code for ASP.NET MVC views unless you configure your ASP.NET MVC project to pre-compile views with symbol information.
Note: You can use Visual Studio's Publish tool to alter the pre-compilation settings of your ASP.NET MVC application. To configure your web application so that Code Pulse can display code coverage for your ASP.NET MVC views, use the Visual Studio Publish tool to open the File Publish Options, check
Precompile during publishing, click Configure, checkEmit debug information, and uncheckAllow precompiled site to be updatable.
Code Pulse links .NET source code to compiled .NET code by comparing the file path of a .NET source code file, relative to an input file, to the absolute file path found in a .pdb file. The root folder of a .NET source tree should appear under the root folder of an input file. For example, consider a file named Main.cs stored on disk in a folder C:\Code\MyApp\Main.cs. Compiling Main.cs generates a program named Main.exe with a .pdb file named Main.pdb. Code Pulse will link MyApp\Main.cs to Main.exe provided that the MyApp folder appears at the root of an input .zip file. Unlike the Java case, storing the MyApp folder in a source folder in the root directory of the archive would not work because Code Pulse would not match the Main.cs relative directory path (source\MyApp) with the absolute directory path pulled from the .pdb file (C:\Code\MyApp).
Note: Code Pulse can read source code from .cs, .vb, .fs, .cpp, and .h files.
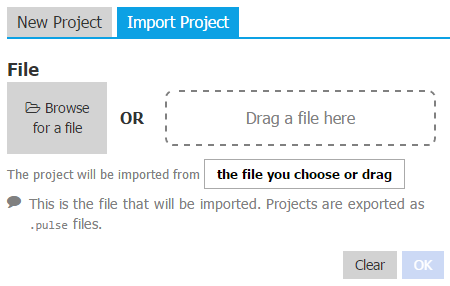
Once you have packaged your application into an input file, use the "Browse for a file" button to open up a file picker dialog and select your file, or simply drag your input file straight from your file system to the "Drag a file here" area.

With the form filled in, click OK to submit it (or the "Clear" button to reset what you changed). Code Pulse will add your project to the Project List displayed on the left and start working to create a new project by building application inventory items from what it finds in your input file.
If Code Pulse does not recognize any content in your input file, it will reject your upload and display an error message:
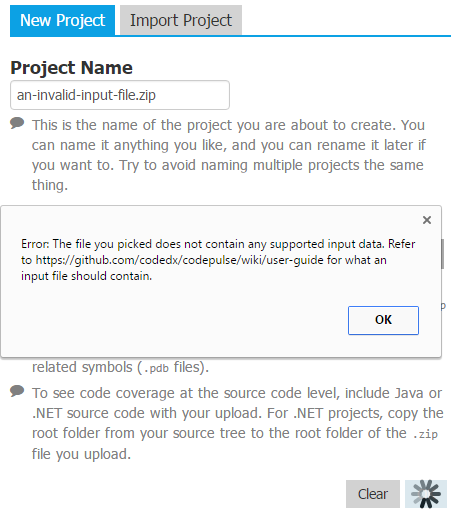
The processing time will depend on the size of your input file and could take a few minutes to complete. Once the data is ready, Code Pulse will show the Project Details screen, which you can return to at any time using the Project List.
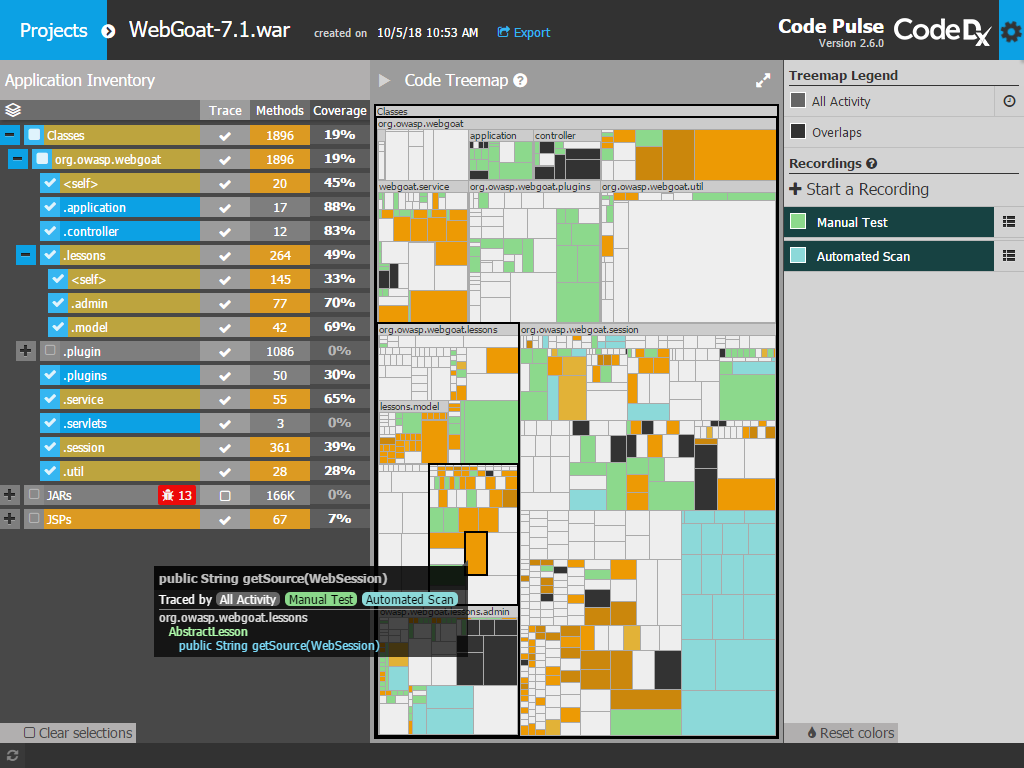
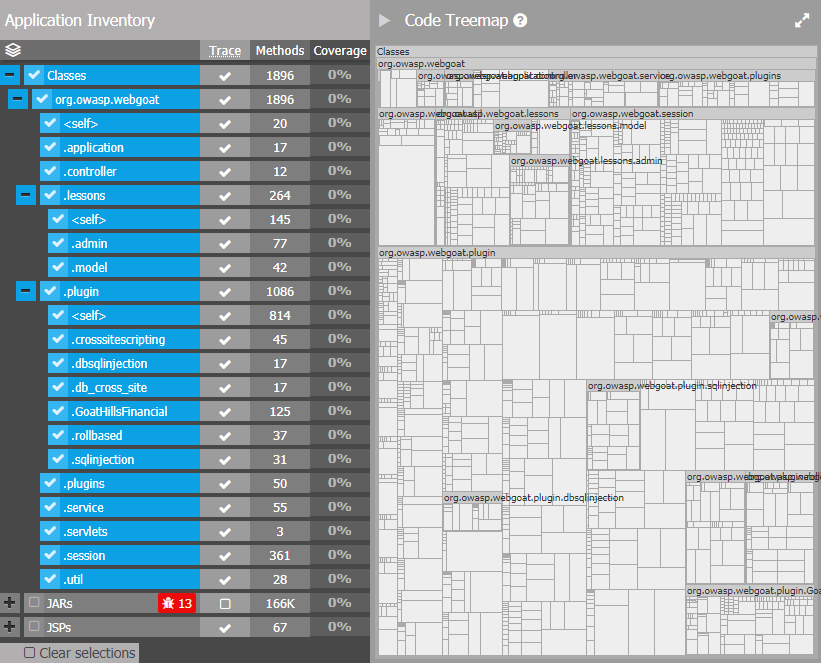
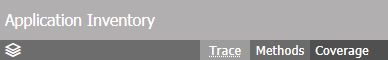
The Project Details screen includes the Project Header, Application Inventory, and Code Treemap. When you start tracing your application, it will present code coverage details at the method and source code level (where applicable).
At the top of the screen, the header contains a bunch of info.

The "Projects" button slides the Project List into view. To the right of the "Projects" button, the current project's name is displayed. If the project happens to have the same name as another project, you'll see a warning suggesting that you change the name. You can change a project's name by clicking on its name display in this header area, typing a new name in the text field that appears, and then pressing Enter.
The "Export" link can be used to export a copy of your project for sharing with others.
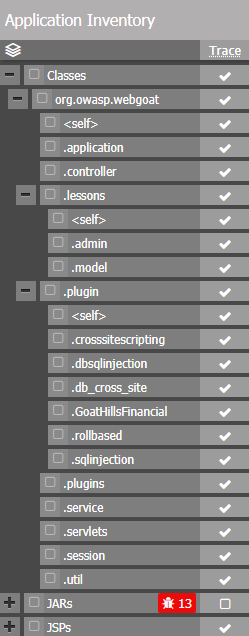
The Application Inventory shows a high level view of the components that Code Pulse analyzed in your project. The inventory is represented as a tree list; each component is represented as an item in the list, and each component's children are represented as sub-items of its respective item.
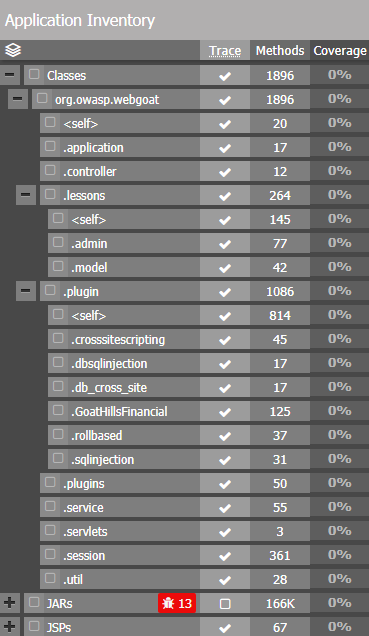
Each item in the application inventory has the following sections, listed from left to right:
-
Expand/Collapse Button: If the item has children in the package/group hierarchy, there will be a "+" button at the far left. Clicking the button expands the item's children. Clicking it again collapses the children.
-
Selection Check Box: Clicking this box selects the corresponding item and all of its children. Selected items are then displayed in the Code Treemap.
-
Name Label: Displays the name of the package or group. Clicking the name also selects the check box.
Note: In some cases, Code Pulse needs to make the distinction between "classes in package 'com.foo.bar'" and "classes in package 'com.foo.bar' and any of its sub-packages". If there is the need to express the former ("classes in package 'com.foo.bar' but not its sub-packages), Code Pulse will generate a "<self>" node to represent it, as a child of the package it represents.
-
Trace Selection Check Box: This check box is used to determine which classes will be instrumented when Java tracing is in progress. Anything not checked here will not be considered for tracing. This is useful if you create your project by uploading a large Java application with aspects such as third-party dependencies that you don't want to trace. By default, Code Pulse will pick classes from the "Classes" and "JSPs" groups to be instrumented, ignoring classes from the "JARs" group.
Note: This applies only to Java projects. For .NET projects, use the filter feature of the Code Pulse .NET Tracer.
-
Method Count: Shows the total number of methods found within the package/group and any of its children.
-
% Coverage: A bar chart that shows the percentage of methods that have been encountered by the trace (affected by any trace filters). While the trace is running, these bars will generally grow, as methods in the program are encountered.
Note: When the treemap is in view, the percent coverage bars are collapsed; only the percent label is visible instead of the bar.
When you create a new project, Code Pulse runs the bundled OWASP Dependency-Check tool on the application you packaged. When the results are available, Code Pulse adds to the Application Inventory an icon that shows the number of vulnerable dependencies found in the Dependency-Check report.
Note: The OWASP Dependency-Check tool requires Internet access as described here.
A green icon containing a zero means that the tool did not found any vulnerable dependencies.

A red icon represents a report containing one or more vulnerable dependencies. You can click a red icon to access a link to the full report:
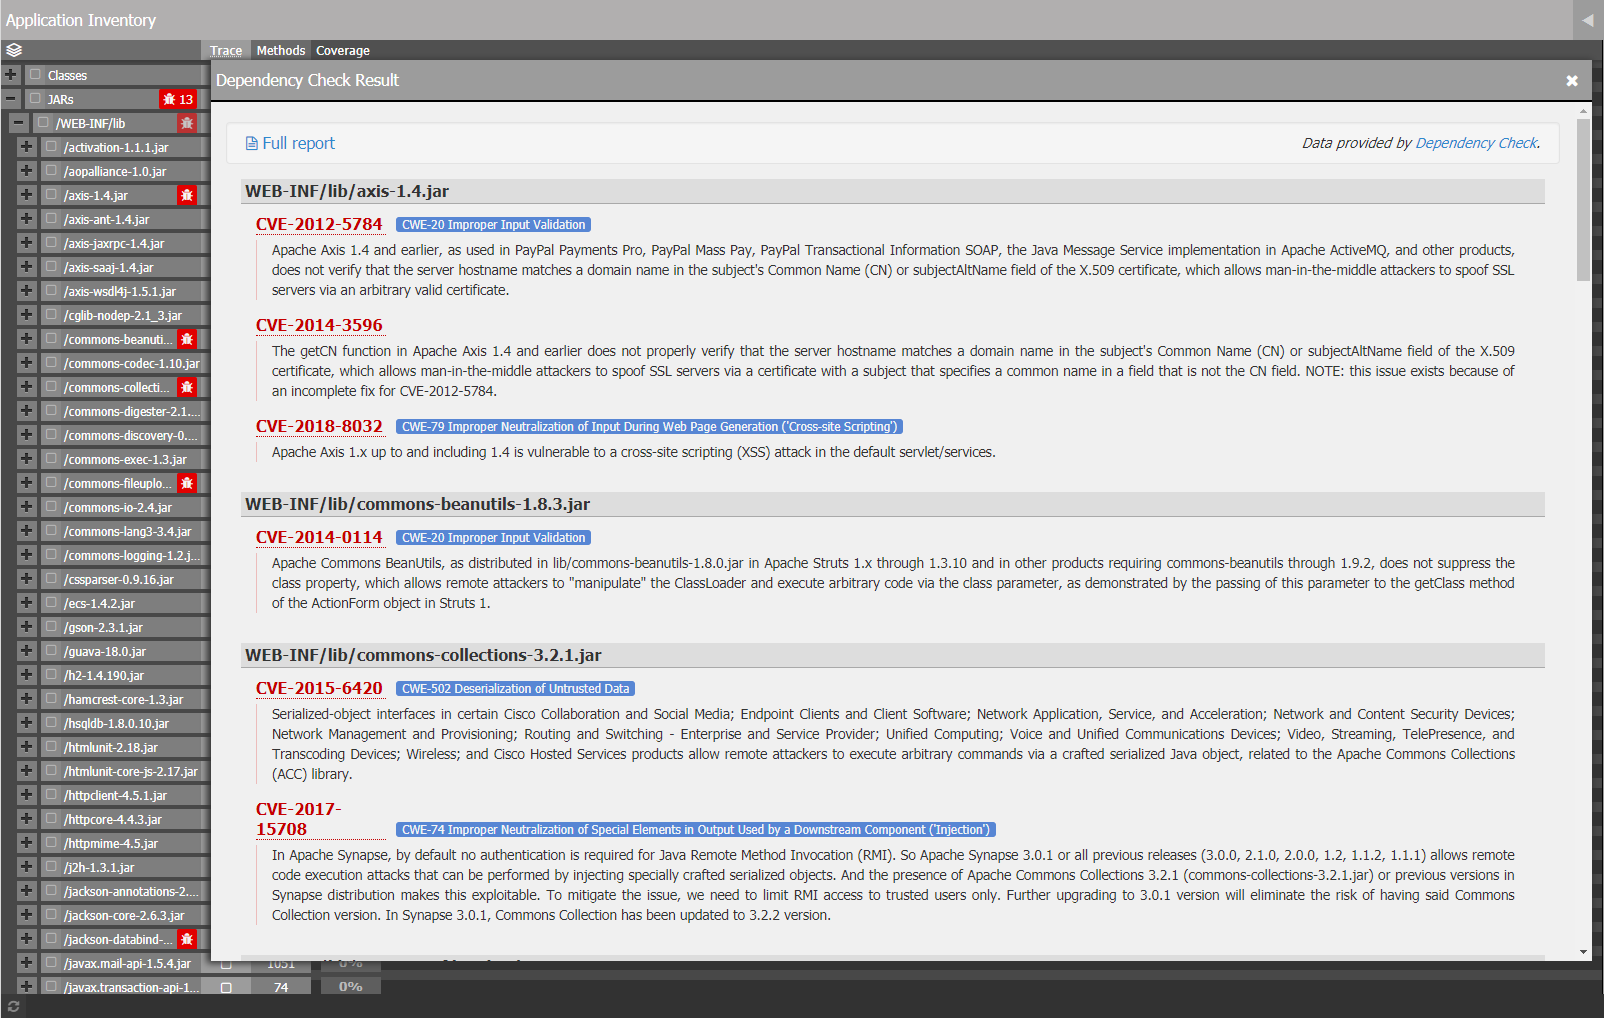
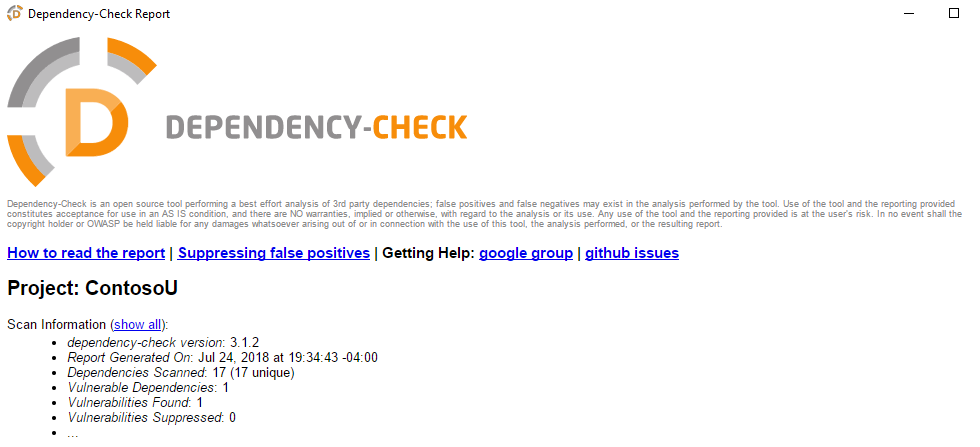
Click Full report to open the report generated by the Dependency-Check tool:
Note: When you export a project, the Dependency-Check data is not included.
When creating a Java project, Code Pulse searches your input file for .class files. When it finds .class files, the corresponding classes are assigned to the "Classes" group. When it finds .jar files or other compressed archives within the main file, it assigns any .class files within that sub-archive to the "JARS" group. When it finds a .jsp file, it creates a corresponding entry under the "JSPs" group.
When creating a .NET Framework project, Code Pulse searches your input file for .dll/.exe files and uses related .pdb files to find .NET class names. Classes are organized by namespaces and are grouped by nodes representing the assemblies to which the classes belong.
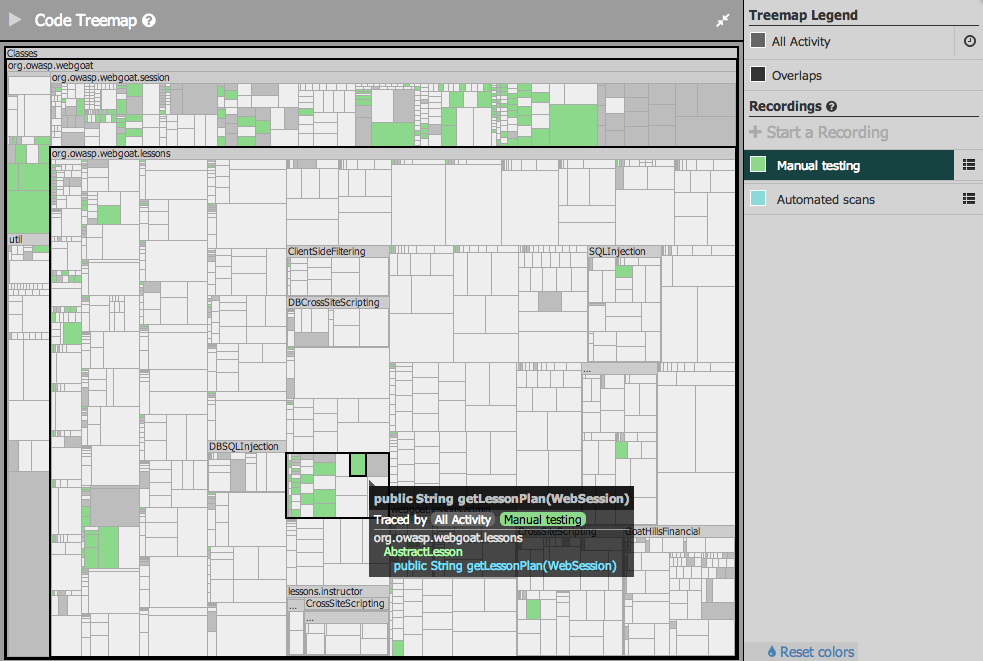
A treemap is a visualization that displays hierarchical data by using nested rectangles. In Code Pulse's case, we display selected content from the application inventory.
When you open the Project Details screen, the treemap is hidden in a "drawer." To "open" the drawer, click on the button with the triangle icon in the Application Inventory header. Initially, the treemap will only show a prompt asking you to select items from the application inventory:
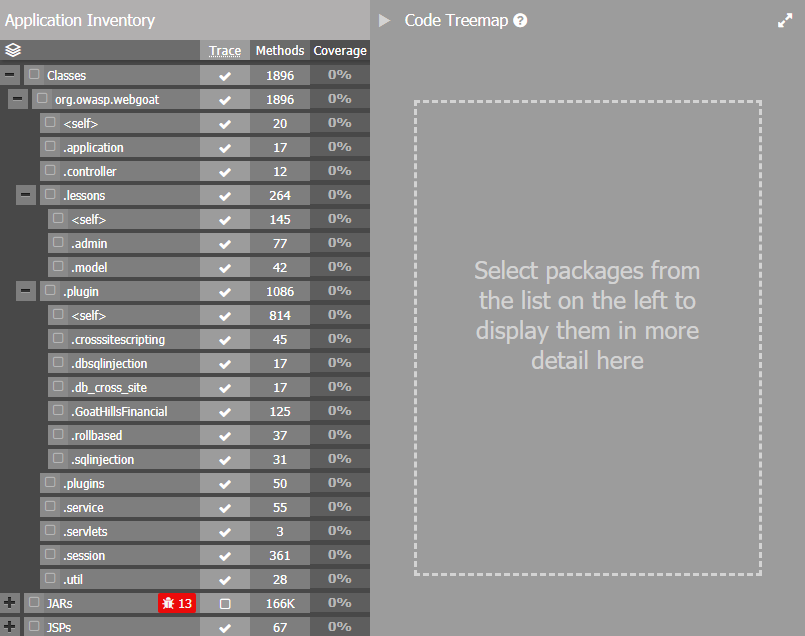
The selection of application inventory items controls the contents of the treemap. No selection means no content. By selecting an item like com.foo.bar from the "Classes" group, the treemap will change to display a visualization of the packages, classes, and methods within com.foo.bar.
Once you've selected something for the treemap to display, hovering the mouse over the treemap will display a tooltip with more info about the particular "node" you are pointing to. In all cases, it will display some contextual information about where the node exists; for example, if you point to a method, the tooltip will show you what package and class that method belongs to. Also for methods, the tooltip's title shows the method's "signature" (i.e. public void foo(Object, String)) If a node has not been selected for tracing (by the Trace check box in the Application Inventory), it is indicated in the tooltip.

The area of each method displayed in the treemap is proportional to the number of instructions (Java instructions or .NET Framework instructions) in the method. Classes are sized to fit their children, and packages (and groups) are sized to fit their own children plus a small area to show their name.
The name area is not always wide enough to fit the entire name. For example, a package named com.example.foo.bar.example may be displayed as "example" because the area wasn't wide enough to fit the entire text. You can always see the full text in the tooltip by mousing over the package's title area.
Once you've connected your application to Code Pulse and started a trace, the treemap will start reacting to the new information that Code Pulse finds.
This section describes how to connect a Code Pulse agent to your application.
Note: Connecting a Code Pulse agent to your application adds some overhead, so expect some slow down, especially when parts of your application run for the first time. Specifying filters can reduce overhead by limiting the scope of the tracing to a specific portion of your application. Refer to Java Tracing Filter and .NET Framework Tracing Filter for details.
The -javaagent parameter allows you to hook your Java application into Code Pulse. Connecting your Java application to Code Pulse involves specifying the contents of the -javaagent parameter and providing it to the Java virtual machine (JVM).
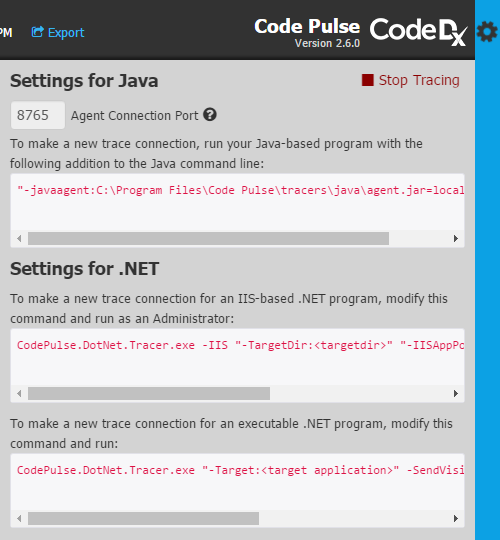
The Code Pulse Settings window, accessible by clicking the gear icon in the upper right corner of the Project Details page, includes a Settings for Java section that shows an example -javaagent parameter.
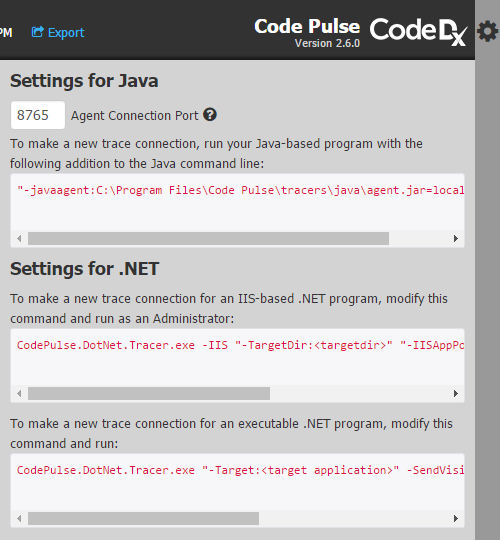
You can also create the -javaagent parameter from scratch using the string below by replacing </path/to/agent.jar> with the actual path where you found your agent.jar file, and <port> with the port number Code Pulse expects to use.
"-javaagent:</path/to/agent.jar>=localhost:<port>"
Port number 8765 is the default port, but you can use the Settings for Java window to switch the Agent Connection Port to another number.
Note: You could also change
localhostto be an IP address. You could use this to run the traced application on one machine, and Code Pulse on another. For example, if Code Pulse is running on a machine accessible through the network at address192.168.55.55and listening on port8765, you could replacelocalhost:<port>with192.168.55.55:8765.
You can also change the Agent Connection Port by setting the CODE_PULSE_TRACE_PORT environment variable before running Code Pulse.
To assist with any necessary troubleshooting, the Java agent can write messages to a log file, which you can enable by appending ;log=</path/to/logfile> to the -javaagent parameter, replacing </path/to/logfile> with the location of the log. For example, to store the log file in the C:\temp folder, replace </path/to/logfile> in the following string with c:\temp\log.txt.
"-javaagent:</path/to/agent.jar>=localhost:<port>;log=</path/to/logfile>"
Note: When specifying a log file in the
-javaagentparameter, the account running your application must have write permission to the log file location.
Note: For more information on viewing application logs, see the Viewing Code Pulse Logs section.
How you provide the -javaagent parameter to the JVM depends on your application type.
This section describes how to use the command line to connect the Java trace agent to your Java program. If your application is a web application, skip this section and follow the steps in either Java Apache Tomcat Applications or Java Eclipse Jetty Applications.
Once you have determined your -javaagent parameter, add it as the first argument to the command that is used to run your Java application. Let's look at an example. For this example, the -javaagent parameter will be
"-javaagent:C:/CodePulse/agent.jar=localhost:8765" and the command that you would enter to run your Java application without tracing is java -jar myapp.jar. To run the application with tracing, add the -javaagent parameter as an extra argument in the command line:
java "-javaagent:C:/CodePulse/agent.jar=localhost:8765" -jar myapp.jar
If everything goes well, your application should start up and initiate a connection to Code Pulse. You can start the trace by clicking the "this project" link in the following notification popup on your screen:
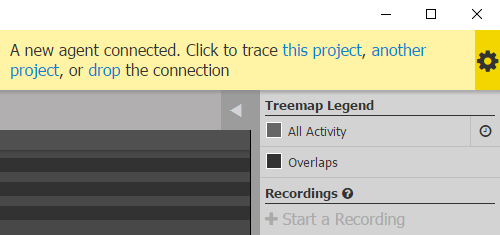
Note: If the current project you're viewing isn't the one you want to associate the trace with, you have the option of selecting a different project, including creating a new one if needed.
Your application should appear to run exactly as it normally does. If something went wrong, you might see an error message in the console when you try to run your app. If you specified a log file in the -javaagent parameter, check the log for additional details.
Note: For more information on viewing application logs, see the Viewing Code Pulse Logs section.
Closing the application will cause the trace to end.
The Java agent supports tracing web applications running on Apache Tomcat. Like Java desktop applications, tracing an application running on Tomcat requires the addition of the -javaagent parameter.
To configure the agent for Tomcat running in a *nix environment (such as Linux or macOS), modify (or create, if it doesn't exist) tomcat-installation-folder/bin/setenv.sh to add the -javaagent parameter to CATALINA_OPTS. For example, add the following line:
export CATALINA_OPTS="$CATALINA_OPTS \"-javaagent:/path/to/agent.jar=localhost:8765\""
If you are not running Tomcat as a service on Windows, you can modify (or create, if it doesn't exist) the tomcat-installation-folder/bin/setenv.bat file to add the -javaagent parameter to CATALINA_OPTS. For example, add the following line:
set CATALINA_OPTS=%CATALINA_OPTS% "-javaagent:/path/to/agent.jar=localhost:8765"
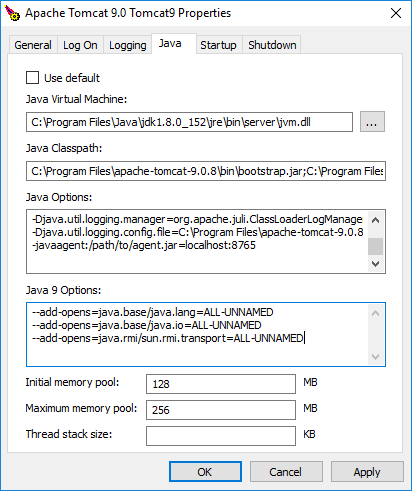
The recommended way to configure Tomcat if it is installed as a Windows Service is to use the Tomcat Service Manager, which can be found in the Start menu at Apache Tomcat › Configure Tomcat. Go to the Java tab, and in Java Options, add the -javaagent parameter on its own line.
With Code Pulse running, restart Apache Tomcat after updating its configuration and accept the trace connection in Code Pulse to allow Apache Tomcat to initialize.
Note: If the current project you're viewing isn't the one you want to associate the trace with, you have the option of selecting a different project, including creating a new one if needed.
Your application should appear to run exactly as it normally does. If something went wrong and you specified a log file in the -javaagent parameter, check the log for additional details.
Note: For more information on viewing application logs, see the Viewing Code Pulse Logs section.
Shutting down the application will cause the trace to end.
The Java agent supports tracing web applications running on Eclipse Jetty. You may add the -javaagent parameter to the command line when executing Jetty. For example:
java "-javaagent:/path/to/agent.jar=localhost:8765" -jar start.jar
Jetty supports the use of configuration files to control startup as well. You may edit start.ini or add a new ini file in start.d/ (e.g., start.d/codepulse.ini), depending on how you prefer to organize your configuration. You will utilize the --exec option to specify the -javaagent parameter as a JVM argument. For example, your ini file may contain the following lines:
--exec
-javaagent:/path/to/agent.jar=localhost:8765
Note: The Java agent will fail to initialize if you specify the
-javaagentparameter in more than one place, such as on the command line and in a configuration file.
With Code Pulse running, restart Eclipse Jetty after updating its configuration and accept the trace connection in Code Pulse to allow Eclipse Jetty to initialize.
Note: If the current project you're viewing isn't the one you want to associate the trace with, you have the option of selecting a different project, including creating a new one if needed.
Your application should appear to run exactly as it normally does. If something went wrong and you specified a log file in the -javaagent parameter, check the log for additional details.
Note: For more information on viewing application logs, see the Viewing Code Pulse Logs section.
Shutting down the application will cause the trace to end.
The Java agent's communication with Code Pulse adds some overhead, so expect some slow down, especially when parts of the application run for the first time. After creating a Code Pulse project and before connecting the Java agent to your Java application, review the trace settings in the Application Inventory. The Trace check box alongside each Application Inventory item is used to determine which classes will be instrumented when tracing is in progress. Unchecking anything that you do not want to trace will reduce the tracing overhead that may noticeably slow down your application at run-time.
Note: The number of items you trace affects the performance of your application when running it with Code Pulse. By default, Code Pulse will check items from the "Classes" and "JSPs" groups to be instrumented, ignoring classes from the "JARS" group.
By default, Code Pulse requires you to accept an incoming agent connection to start a trace. If you want to skip trace acknowledgment, you can set the CODE_PULSE_TRACE_SKIP_ACK environment variable to either true or yes before running Code Pulse. When bypassing user acknowledgment, you must provide the ID of the Code Pulse project that will receive trace data. You can find the ID of a Code Pulse project under its name in the Project List.
For Java traces, add a projectId parameter to the -javaagent string. For example, -javaagent:/path/to/agent.jar=localhost:8765;projectId=1 will automatically start a trace for the Code Pulse project with ID=1 when the skip user acknowledgment feature is enabled.
The Code Pulse .NET Tracer supports two modes: App Profiling and IIS Web App Profiling. The Code Pulse Settings window, accessible by clicking the gear icon in the upper right corner of the Project Details page, includes a Settings for .NET section that shows example usages of each mode.
How you run the Code Pulse .NET Tracer depends on your application type.
Note: For a detailed usage statement, run
CodePulse.DotNet.Tracer.exewith the-?command line argument.
The -IIS switch enables the IIS Web App Profiling mode, which requires values for the -TargetDir and -IISAppPoolIdentity command line arguments. Specify a -CodePulsePort value if you changed the default Code Pulse port of 8765 in the Settings window or with the CODE_PULSE_TRACE_PORT environment variable before running Code Pulse.
To make a new trace connection for an IIS-based .NET Framework program, run an elevated Command Prompt and enter the following command by replacing <port> with the port number Code Pulse expects to use (e.g., 8765), <targetdir> with the path to the web application binaries (e.g., C:\inetpub\wwwroot\mywebapp\bin), and <domain\username> with the application pool identity of the web application (e.g., IIS AppPool\DefaultAppPool):
"C:\Program Files (x86)\Code Pulse .NET Tracer\CodePulse.DotNet.Tracer.exe" -IIS "-TargetDir:<targetdir>" "-IISAppPoolIdentity:<domain\username>" -CodePulsePort:<port>
Advanced Users: You could also specify the
-CodePulseHost:<host>command line argument, replacing<host>with the IP address of a machine running Code Pulse on the port specified by the-CodePulsePortparameter. For example, if Code Pulse is running on a machine accessible through the network at address192.168.55.55and listening on port8765, you would specify the-CodePulseHost:192.168.55.55and-CodePulsePort:8765command line arguments.
Assuming an IIS .NET Framework web application named ContosoU located at C:\inetput\wwwroot\contosou using the DefaultAppPool identity, the following Code Pulse .NET Tracer command will connect the application to Code Pulse:
"C:\Program Files (x86)\Code Pulse .NET Tracer\CodePulse.DotNet.Tracer.exe" -IIS -TargetDir:C:\inetpub\wwwroot\contosou\bin "-IISAppPoolIdentity:IIS AppPool\DefaultAppPool"
The Code Pulse .NET tracer will pause after it prints the "Open Code Pulse, select a project, wait for the connection, and start a trace" message. Return to Code Pulse and accept the connection to start the trace. The World Wide Web Publishing Service will then restart to bring the trace online.

The Code Pulse .NET Tracer will send code coverage data related to a web request after each completed response. If something goes wrong, you may see an error message in the console when you try to run the Code Pulse .NET Tracer. You may also find messages in the log file stored in your AppData folder under Code Dx\Code Pulse\log-files. The Code Pulse logging shows informational, warning, and error messages by default. For additional details, include debug messages by specifying the -Log:Debug command line argument.
Note: For more information on viewing application logs, see the Viewing Code Pulse Logs section.
Press Enter to end the web application and the trace session. This is the recommended approach for ending a trace because it will also cause Code Pulse to send any code coverage data it recorded separate from a web request, such as calls to ASP.NET startup methods (e.g., Application_Start).
If the World Wide Web Publishing Service stops, the trace will also end.
When the -IIS switch is not specified, the Code Pulse .NET Tracer application runs in App Profiling mode. This requires values for the -Target and -SendVisitPointsTimerInterval command line arguments. Specify a -CodePulsePort value if you changed the default Code Pulse port of 8765 in the Settings window or with the CODE_PULSE_TRACE_PORT environment variable before running Code Pulse.
To make a new trace connection for an executable .NET Framework program, enter the following command by replacing <port> with the port number Code Pulse expects to use (e.g., 8765), <targetpath> with the path to the .NET Framework executable (e.g., c:\apps\myapp.exe), and <milliseconds> with a value greater than 0 (e.g., 1000).
"C:\Program Files (x86)\Code Pulse .NET Tracer\CodePulse.DotNet.Tracer.exe" "-Target:<targetpath>" -SendVisitPointsTimerInterval:<milliseconds> -CodePulsePort:<port>
Advanced Users: You could also specify the
-CodePulseHost:<host>command line argument, replacing<host>with the IP address of a machine running Code Pulse on the port specified by the-CodePulsePortparameter. For example, if Code Pulse is running on a machine accessible through the network at address192.168.55.55and listening on port8765, you would specify the-CodePulseHost:192.168.55.55and-CodePulsePort:8765command line arguments.
The value of -SendVisitPointsTimerInterval determines the number of milliseconds the Code Pulse .NET Tracer must wait before sending code coverage data to Code Pulse.
If something goes wrong, you may see an error message in the console when you try to run the Code Pulse .NET Tracer. You may also find messages in the log file stored in your AppData folder under Code Dx\Code Pulse\log-files. The Code Pulse logging shows informational, warning, and error messages by default. For additional details, include debug messages by specifying the -Log:Debug command line argument.
Note: For more information on viewing application logs, see the Viewing Code Pulse Logs section.
Use App Profiling mode to use Code Pulse with an application hosted by IIS Express. Specify the path to iisexpress.exe for the -Target parameter and use the -TargetArgs parameter to specify the iisexpress.exe command line arguments. The -TargetDir parameter must point to the folder containing the web application binary and pdb files.
Below is an example of using the CodePulse.DotNet.Tracer.exe with a web application in the C:\users\user\code\apps\webapp folder.
"C:\Program Files (x86)\Code Pulse .NET Tracer\CodePulse.DotNet.Tracer.exe" "-Target:C:\Program Files\IIS Express\iisexpress.exe" "-TargetArgs:/path:C:\users\user\code\apps\webapp /port:6789" -TargetDir:C:\users\user\code\apps\webapp\bin -SendVisitPointsTimerInterval:500
Filters control the scope of the Code Pulse .NET Tracer and can reduce the amount of tracing overhead. A filter string added to the CodePulse.DotNet.Tracer.exe command line can either include or exclude parts of a .NET Framework application.
Inclusion filters begin with + and exclusion filters start with -. The assembly follows and consists of an assembly name in brackets. The type filter comes last. Both the assembly and type filter can include an * as a wildcard character. Wrap two or more filter strings with double quotes and separate them with spaces.
As an example, here's the filter parameter value to include types in the ContosoUniversity.Controllers and ContosoUniversity.DAL namespaces of an assembly named ContosoUniversity:
-Filter:"+[ContosoUniversity]ContosoUniversity.Controllers* +[ContosoUniversity]ContosoUniversity.DAL*"
You can specify a filter based on namespace by using a wildcard filter to ignore assembly name. For example, here's the filter parameter value to include types in the ContosoUniversity.Controllers namespace regardless of assembly name:
-Filter:"+[*]ContosoUniversity.Controllers*"
By default, Code Pulse requires you to accept an incoming agent connection to start a trace. If you want to skip trace acknowledgment, you can set the CODE_PULSE_TRACE_SKIP_ACK environment variable to either true or yes before running Code Pulse. When bypassing user acknowledgment, you must provide the ID of the Code Pulse project that will receive trace data. You can find the ID of a Code Pulse project under its name in the Project List.
For .NET traces, specify a ProjectId parameter on the CodePulse.DotNet.Tracer.exe command line. For example, the following command will will automatically start a trace for the Code Pulse project with ID=1 when the skip user acknowledgment feature is enabled.
"C:\Program Files (x86)\Code Pulse .NET Tracer\CodePulse.DotNet.Tracer.exe" "-Target:<targetpath>" -SendVisitPointsTimerInterval:<milliseconds> -CodePulsePort:<port> -ProjectId:1
Once a Code Pulse agent is connected to your application and you have approved the connection in the Code Pulse application, the trace status indicator at the top right of the application will change to its running state indicating that the agent is active and sending data as expected to Code Pulse.

While tracing your application, Code Pulse listens to find out which methods were called. Whenever a method is called, the parts of the screen corresponding to that method are highlighted. In the treemap, the corresponding node will flash orange and eventually fade back to its original color. The same orange flashing effect will happen with the method's associated parents in the application inventory.
Code Pulse is a code coverage tool, so of course it helps you see how many of the methods were called overall. The best way to see the total run-time code coverage of your program is to watch the application inventory's % Coverage column. Each item has a bar fill that indicates the percentage of methods belonging to that item that were called during tracing. Another way is to watch the treemap. Since it colors items based on whether they were encountered during tracing, you can get a rough idea of what proportion of the program was actually executed by seeing how much of the treemap is colored in.

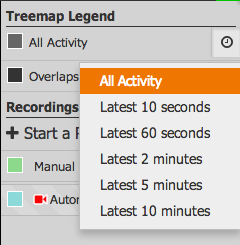
At the right side of the Project Details page, you will find the Treemap Legend area followed by the Recordings area.

As methods are called or JSP files visited, the treemap will flash highlight the corresponding node to indicate the real-time activity. In addition, these methods and/or JSP files that have been visited are then flagged as covered and get the All Activity color from the Treemap Legend. This color can be changed by clicking on the color swatch to the left of the All Activity text (see Colors for details on how to do so).
By default all the activity from the start of the trace is highlighted in the treemap for the currently selected code groupings. However, as needed you can elect to highlight trace activity from a number of different timing options by clicking on the activity ticker icon to the right of the All Activity legend entry.
To enable trace activity organization, Recordings are made available to the user. Just like with an A/V recording, the trace recording will keep a record of coverage activity from the moment you create a recording to the moment you stop it.
To start a recording, simply click the Start a Recording button. (Note: the Start a Recording button is only enabled while tracing.) New recordings are initially untitled. You can change a recording's name at any time via the recording's drop-down menu.
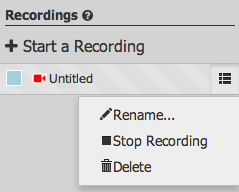
You can stop or delete existing recordings at any time, from their drop-down menu. Once a recording is stopped, it does not start again. Any new activity in the traced application will be ignored by that recording. A stopped recording remembers all activity that it saw while it was running, so it can still be selected to view its information. Deleting a recording completely removes it, and cannot be undone. However, note that deleting a recording does not delete the coverage information that was tracked for the overall trace. Recordings are merely time markers and do not "own" the trace data they group.
By selecting a recording the rest of the screen reacts displaying information about the traced methods that were called during that recording. To select one, simply click on its name. The Application Inventory will update its % Coverage column to reflect the methods covered by the selected recording. When there is no selection, the coverage data is for the entire trace, regardless of recordings. The treemap will update its colors to indicate which of the displayed methods were traced during the selected recording. If multiple recordings are selected, and a method was traced by more than one of them, the treemap will use the Overlaps color, rather than randomly choosing a recording's color. The treemap's tooltips will also show information about which recordings observed their respective methods.
Your selections under Treemap Legend and Recordings affect what coverage information is shown in the application inventory and the treemap. With default setttings, Code Pulse will show you the grand total of coverage. When you select a recording or change the timing filter, it shows you the coverage information specific to what you selected.
Selecting multiple controls will show the union set of coverage between your selections. For example, switching All Activity to Latest 10 seconds and selecting a recording will show you everything that happened during the recording in addition to code coverage data from the last 10 seconds.
To change a control's associated color, click on the color swatch (the colored square next to its name) to open a color chooser popup. Once you find a color that you like, click the OK button. Clicking the Cancel button, or anywhere outside the popup will close the popup and set the color back to whatever it was before you opened the color chooser.
If you ever want to go back to the default colors, you can use the Reset colors button at the bottom of the area.
All Activity and Overlaps are always implicitly selected. The All Activity color is used as the default color for any method that was traced. If other selections are made, the All Activity color gives way to those other selections, and fades away to become less prominent.
Note: Treemap items colored using the activity filter color may fade when a recording gets selected, but the color displayed in the Treemap Legend stays the same.
The Overlaps color is used when a method was traced by multiple selected recordings.
When you click a code treemap item, Code Pulse opens its source code viewer. If you created your Code Pulse project from an input file that included source code and source code is available for the treemap item you clicked, Code Pulse displays the related method source code and source file path. If the project's input file did not contain source code for the item you clicked, then Code Pulse displays the "Source unavailable" message.
You can dismiss the source code viewer and restore your view of the treemap by clicking the close button in the upper right corner of the display.

The Java trace agent and the .NET Framework trace agent both report code coverage for source locations. Code Pulse defines a source location as a piece of code that a Code Pulse agent can observe as having been run during program execution. A source location refers to a portion of the source code. It could span multiple lines or be a partial line.
The scope of a source location depends on a trace agent's capabilities. For Java, a source location typically refers to a line of source code, and an entire line of code is considered to have been run when a program invokes any portion of code on that line. The .NET agent reports code coverage at a more granular level. For .NET, a source location refers to a sequence point, and an entire line of code is considered to have been run when all sequence points on that line ran. So the source code viewer may highlight only a portion of a line when displaying code coverage data for .NET source code.
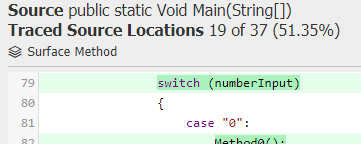
The source code language and the capabilities of the Code Pulse agent for that language determine the total number of source locations for a given method. When a Code Pulse agent detects code coverage associated with a source location, the source location is considered a traced source location. Code Pulse includes the total number of source locations in the header of its source code viewer. It also provides the number of traced source locations identified thus far and the number of traced source locations as a percentage of the total.
Note: The Java agent reports line-level code coverage when control returns from a method. Line-level code coverage data is unavailable while a method is running. Keep this in mind if you run a command-line Java program because line-level code coverage data will be unavailable for the main method until it exits when the program ends.
When the source code viewer is open, it will provide live updates. As the agent gathers code coverage data for the program it's monitoring, Code Pulse will update the % of traced source locations and the related source code highlighting.
Note: While the source file may include source code for multiple methods, live updates are available only for the method associated with the clicked treemap item.
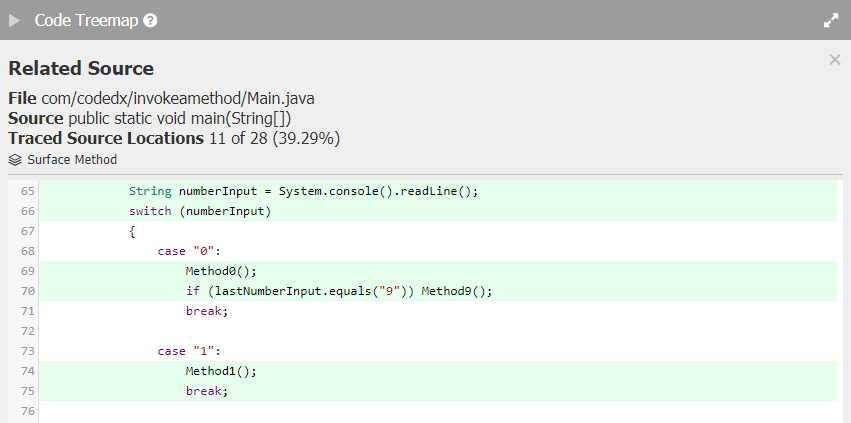
There are cases for both Java and .NET where ambiguity can arise in the source code viewer display based on the current level of code coverage granularity. Let's look at the code coverage detected for a few lines of a program written in both Java and C#.
For the Java case shown below, Code Pulse applied a green highlight from one end of line 70 to the other. Line 70 includes a conditional call to Method9(), one that occurs when the value of lastNumberInput is 9. In our case, lastNumberInput was 1 at run-time, so a call to Method9() did not take place. Since Code Pulse typically highlights entire lines of Java source code, multiple statements on a single line can create an ambiguous display.
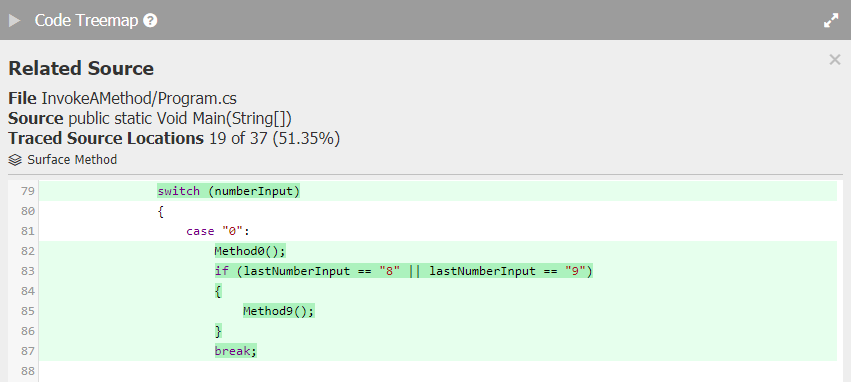
Here's C# code that's similar to the Java example:

Like the Java case, the value of lastNumberInput was 1 at run-time. Code Pulse applied a green highlight to line 83, but it used a darker green highlight to show how the agent detected only one of two sequence points on line 83 as having been run. The .NET tracer works at the sequence point level and can handle multiple sequence points on the same line. The absence of the dark green highlight on Method9() indicates that the method was not run.
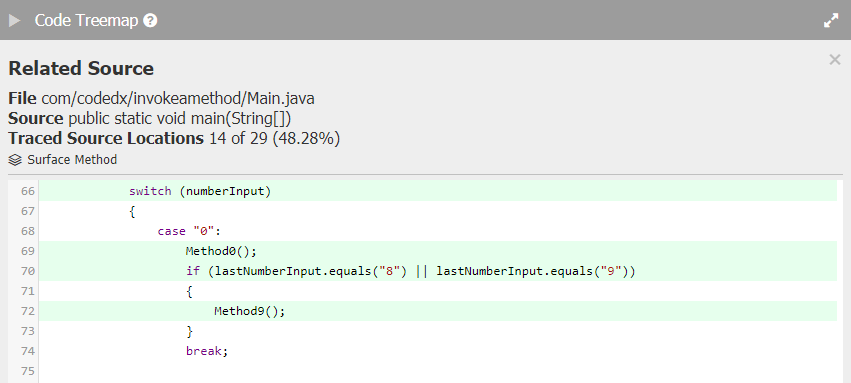
Source code may include one or more branch points. Let's look at the code coverage detected for a few other lines of a program written in both Java and C#. For the Java case shown below, Code Pulse applied a green highlight to line 70. The highlight on line 72 means that Method9() ran, and that means that one of the two equality tests on line 70 evaluated to true. However, it is impossible to tell which one from what's displayed.
The .NET case below shows a similar issue. If a sequence point contains multiple branch points, such as an if statement with two or more equality tests, Code Pulse does not identify the individual branch points that ran. It will instead use a dark green highlight color to highlight the entire sequence point representing the if statement. This ambiguity makes it difficult to see the conditions under which a particular branch of code ran.
The software used to trace Java applications has two known limitations.
If there is any branching logic before the call to the superclass constructor (<init>), the runtime agent will be unable to instrument that constructor and code coverage data will be unavailable for that constructor.
The standard javac Java compiler typically will not allow such constructors to be created (the first statement of the constructor in Java must be the super(...) call). It appears that such constructors are primarily generated by the compilers for other languages that run on the JVM, such as Groovy.
If a constructor is detected that is too complex to instrument, the class and constructor signature(s) will not be instrumented, and code coverage data will be unavailable for that entire class.
Large methods may fail to instrument if they become larger than 64KB. If this occurs, the entire class will not be instrumented, and code coverage data will be unavailable for the whole class.
To stop an active trace you can either stop it from Code Pulse or just stop the target application itself. When you stop the target application, the tracer will send any remaining data to Code Pulse. Alternatively, to stop the trace from Code Pulse, click on the trace status button (the gear icon at the top right of the application) and select the Stop Tracing button. Note that this button is only visible when a trace is active.
An application may contain a number of endpoints - URLs or locations where a web service can be accessed by a client application. These endpoints may allow an unauthorized user the ability to enter data or extract data from that environment. The sum of those different endpoints is known as the attack surface of an application.
Code Pulse leverages the Attack Surface Detector CLI (ASD) to find the attack surface and subsequently display it to you within Code Pulse. The ASD runs automatically for each project when it is ingested. Once ingestion is complete, surface information is available to Code Pulse for display. Nodes in the treemap are marked with an icon that indicates if the node - a method - is a surface method.
The application inventory provides access to functionality that will filter the treemap display to show only surface methods and will highlight in the application inventory only nodes that contain surface descendants. This functionality is accessed by toggling ON the surface mode button present under the application inventory title.
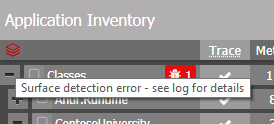
The surface mode button provides information about the state of surface methods within the application. Hovering over the button will display a tooltip which will indicate if the ASD is processing, indicate if there are results, or will provide a count of surface methods detected. In the case of a failure during processing, the button may also indicate an error has occurred.
Note: The surface mode button will be enabled when there are surface methods present. Otherwise, this button will be disabled.
While surface mode is ON, the application inventory limits the selection of nodes to only leaf nodes that contain surface descendants. Other items in the application inventory are disabled.
Note: If surface mode is enabled when the count of surface methods goes to zero, the surface mode toggle will remain enabled so that you may toggle it off so that you can resume normal Code Pulse operations.

It is possible that an error can occur while processing the attack surface for your application. In this case, the surface mode icon will turn a red color with tooltip text alerting you to the fact there has been an error in ASD processing.
The source viewer contains an indicator of whether the source method being viewed is a surface method or not. The ASD looks at source code for particular web frameworks, which initially determines if a method is a surface method or not. However, it is possible the ASD does not know about other frameworks that may also expose an endpoint that adds to the attack surface, so there is the ability to manually toggle whether a method is a surface method.
A method may be marked as either a surface method or not a surface method. This indicator displays that status and also allows you to override that status. By clicking the icon, you may toggle the surface status of the method to on or off.
The various markings used to indicate surface are as follows:

The "surface off" icon is used in the surface mode toggle and the surface mark in the source viewer. As part of the surface mode toggle, it is used to indicate that the surface mode is turned off. As a part of the source viewer, it is used to indicate that a method is not a surface method.

The "surface on" icon is used in the surface mode toggle, surface marks in the treemap, and the surface mark in the source viewer. As part of the surface mode toggle, it is used to indicate that the surface mode is turned on. As a surface mark in the treemap, it is used to indicate that a method is a surface method. Finally, as a part of the source viewer, it is used to indicate that a method is a surface method.

The small "surface on" icon is used as a surface mark in the treemap. This mark indicates that a method is a surface method but is used when visual space is limited.
These surface marks in the treemap gives the ability to quickly see what the web application attack surface is for your application.
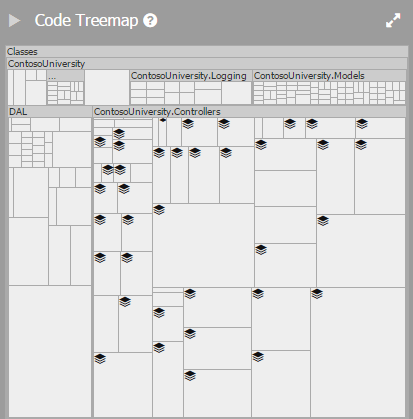
In the above screenshot, a number of methods have been marked as surface methods within the ContosoUniversity.Controllers package. These methods stand out from the other methods in the treemap and make it easy to spot the attack surface of your application.
Due to the use of colors in the treemap, the surface marks in the treemap have adaptive coloring which maintains a high contrast between the mark and the background.
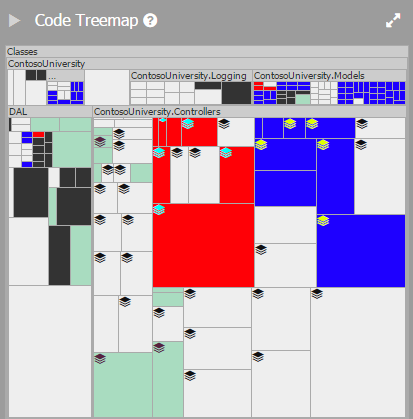
Notice in this screenshot that the red colored nodes have a light blue surface mark icon and the blue colored nodes have a yellow surface mark icon. This is due to the adaptive coloring to maintain high contrast with colored nodes.
When a project is loaded, the ASD will run in the background working to detect the attack surface of the application. During this time, you can still interact with Code Pulse. If you load the treemap or view source for a method during this time, it's possible you will not get appropriate surface method indications. Once surface data is made available, these areas will work as expected.
Due to the layout of the treemap, we make use of two different icons to accommodate smaller and smaller spaces. It is possible, however, that the space available is too small. In such cases, the icon may be too small to see or may not be present at all.
Note: This only affects the display in the treemap. Viewing the source of the method will still show the appropriate indicator.
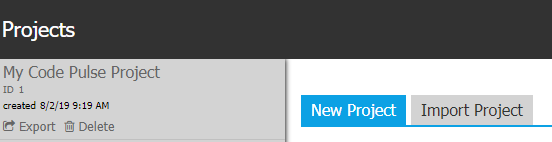
As you create and import projects, they will be added into the Project List. It lets you can navigate between projects, export them for sharing, and delete them. The Project List can be found anywhere you go in Code Pulse. On the main screen, it's featured prominently on the side. On the Project Details screen, it is hidden at first, but will slide into view when you click the "Projects" button at the top.
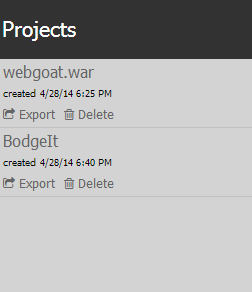
Each item in the project list has the following parts:
- Details Link: The name of the project in the list serves as a link to open the Project Details screen.
- Created Date: Shows when the project was created by you or by the person who shared the project with you.
- Imported Date: Shows when you imported the project, if you imported it.
- Export Link: Lets you export your project so that you can share it with others.
- Delete Link: Lets you delete the project.
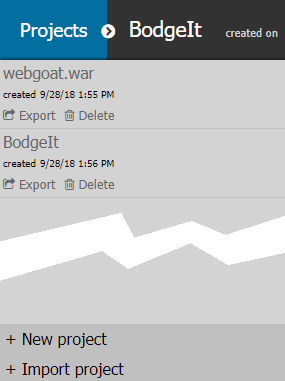
When accessing the project list from a Project Details screen, you'll see two extra buttons at the bottom of the list area; one for creating a new project, and one for importing an exported project file. These buttons will bring you to their respective forms on the main screen.
Projects can be shared. Once you create a project, you can export the project by clicking the "export" links in either the Project List or on the Project Details screen. Exported projects have a .pulse file extension, and each .pulse file includes the uploaded input file and all of the project data, to include trace data, gathered thus far. Project export files do not include Dependency-Check data.
A .pulse file can be given to a friend or coworker (or whoever you want!). If they have Code Pulse installed, they can import the project that you sent them.
If someone sends you a project that they exported, you can import it using the Import Project form. Projects created from importing .pulse files will not include Dependency-Check results/reports.
You can get to the Import Project form from Code Pulse's home screen by clicking the tab at the top. From anywhere else, just open the project list and click the "Import Project" button.
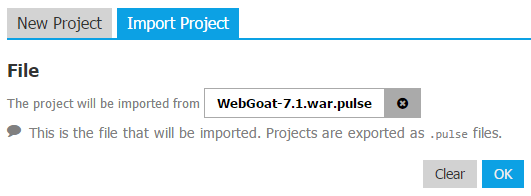
The Import Project form and its controls are similar to the New Project form, except that you don't need to pick a name; the name is included in the exported project file. All you have to do is pick the project file (it has a .pulse file extension) that you want to import, then click OK.
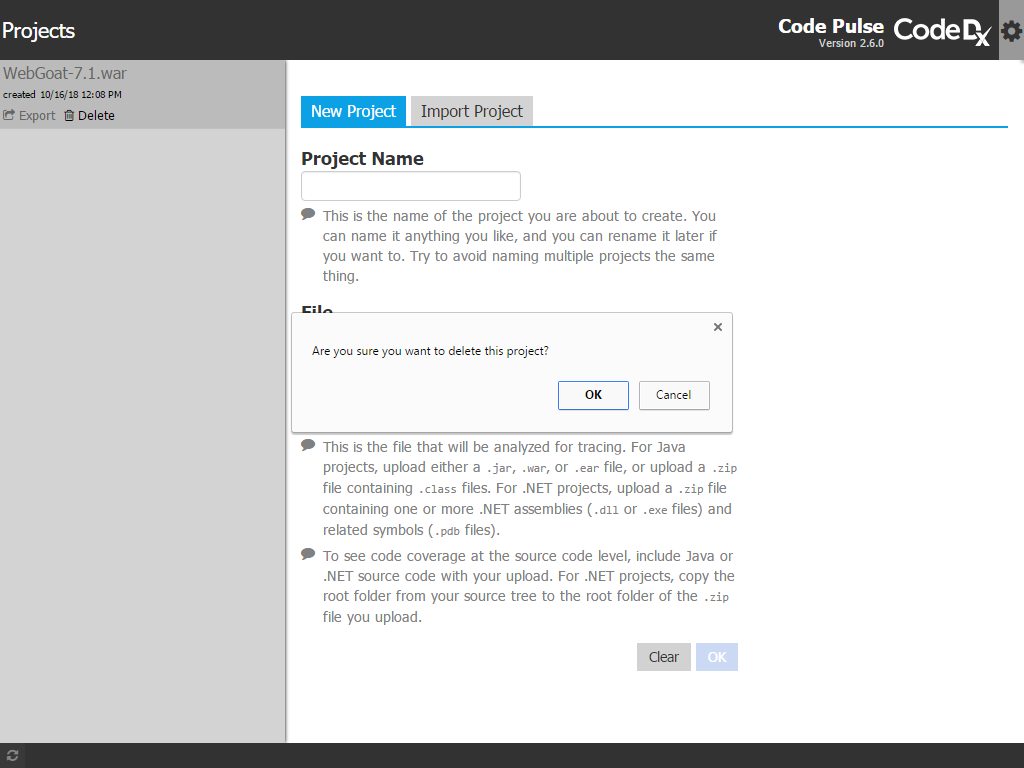
When you click the delete link, Code Pulse will display a confirmation dialog. Click OK to delete the project. Deleted projects cannot be recovered.
Code Pulse supports running multiple Code Pulse instances with separately stored configuration and project data. Each instance is identified by a name that can be set with the CODE_PULSE_INSTANCE_NAME environment variable before running Code Pulse. Instance names have a maximum length of 50 characters and can contain alphanumeric characters, dashes, and underscores.
Note: Code Pulse uses an underscore to replace any invalid characters found in an instance name.
If you want to run multiple Code Pulse instances at the same time, you must use different Code Pulse instance names and you must specify an extra command-line parameter when running Code Pulse. Use the --user-data-dir parameter to specify a directory where application framework data can be stored; each concurrently running Code Pulse instance must specify a different directory, and remember to override the default trace port and symbol service port when running more than one Code Pulse instance at a time.
The following Windows example starts two Code Pulse instances running concurrently. The first instance, named Instance1, uses %TEMP%/CP-Instance1 for its user data directory and the default trace and symbol service port numbers (8765 and 49582). The second instance, named Instance2, runs with user data directory %TEMP%/CP-Instance2 and 8766 and 49583 for the trace and symbol service ports respectively.
C:\> set CODE_PULSE_INSTANCE_NAME=Instance1
C:\> codepulse --user-data-dir=%TEMP%/CP-Instance1
C:\>
C:\> set CODE_PULSE_INSTANCE_NAME=Instance2
C:\> set CODE_PULSE_TRACE_PORT=8766
C:\> set SYMBOL_SERVICE_PORT=49583
C:\> codepulse --user-data-dir=%TEMP%/CP-Instance2
On macOS and Linux, you can simply delete the Code Pulse files from your file system. On Windows, you should use the Windows Installer program to remove both the Code Pulse application and the Code Pulse .NET Tracer from your system.
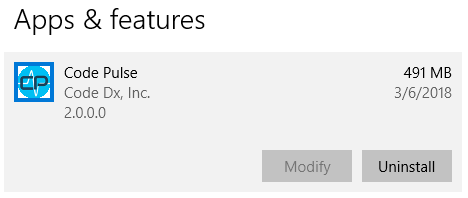
To uninstall Code Pulse, locate the "Code Pulse" entry in the list of installed Windows programs (Apps & Features or Programs and Features), select the entry and click Uninstall.
To uninstall the Code Pulse .NET Tracer, locate the "Code Pulse .NET Tracer" entry in the list of installed Windows programs (Apps & Features or Programs and Features), select the entry and click Uninstall.
Code Pulse has several mechanisms for viewing more detailed information about what is happening within Code Pulse. This information can be especially useful when trying to solve issues or to aid in other support-type requests.
The log files on a Windows Code Pulse version can be found in the directory %APPDATA%\Code Dx\Code Pulse\log-files.
The log files on a MacOS Code Pulse version can be found in the directory /Users/<userid>/Library/Application Support/Code Pulse/log-files/codepulse.log where <userid> is the username.
You can add a command-line option to the codepulse.exe command to redirect the console log to standard error: codepulse --enable-logging=stderr.