We aim to build an exploratory analysis tool for data scientists to find meaningful relationships between variables. The tool will feature a web-based dashboard showing a network graph of variables in a high-dimensional data set, with edges drawn according to a mutual information statistic that is computed server-side. Users can hover over variables to see related variables in a given cluster, and can click on edges between variables to see a graph showing a comparison between variable pairs.
The purpose of this tool is to aid data scientists in understanding information gain across a large swath of variables through meta-analysis, when visually assessing each possible permutation of pairwise variable combination charts would be a daunting task, given the size of the data set. This analytic tool could therefore inform data scientists in choosing features for imputation models, as well as indicate potential unexpected relationships between variables
Sirius has two major components. The data processing tool and the graph tool. The data processing tool is a Python package that runs from the command line. The graph tool is a local web server that visualizes output from the data processor. Details for running each follow below.
The software listed below are needed before getting started.
To help you get started a setup script is provided. Please note that it may not work for all systems. If the script fails, you can run through the steps in the script manually.
# Run setup script.
./util_setup_app.shNow that Sirius has been setup, let do a test run. Run the following commands from the application root.
# 1 - Activate the Conda env
conda activate sirius_env

# 2 - Process example data. A low sample size is used to reduce processing time.
sirius --sample-n=10

# 3 - Visualize the output
python manage.py runserver
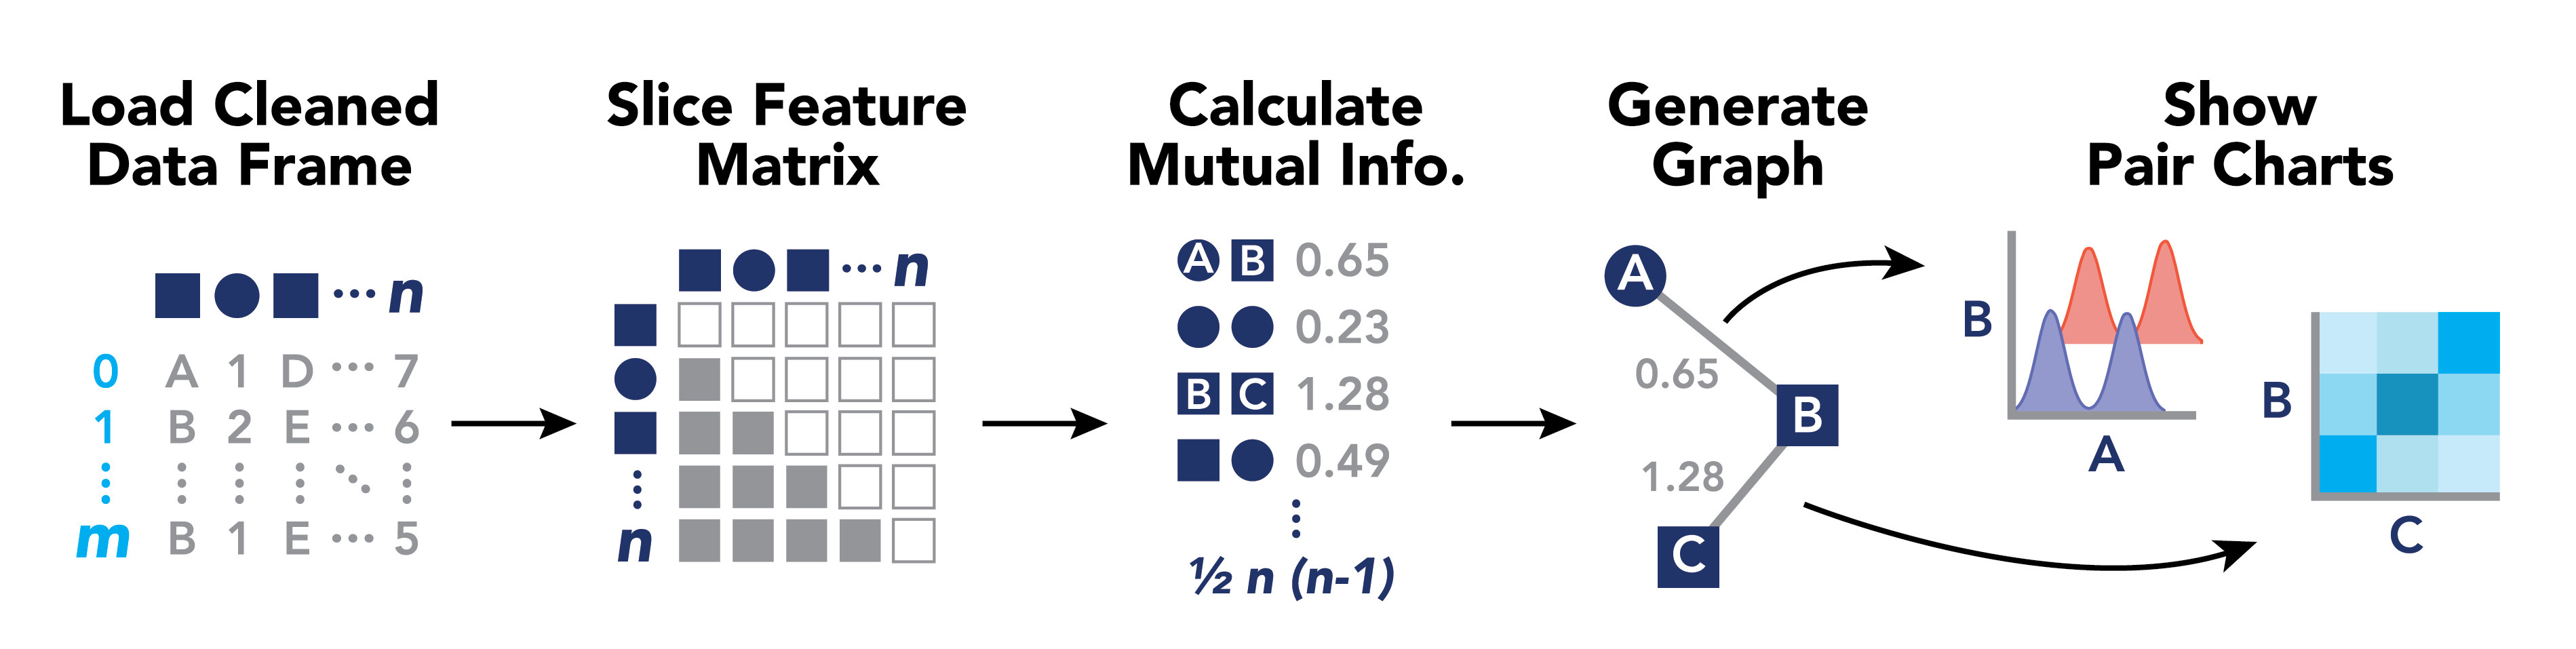
# 4 - Navigate your browser to http://127.0.0.1:8000Sirius works by processing cleaned data to compute pairwise feature relationships using mutual information, and generating a network graph layout for exploratory analysis. The following diagram may be helpful for understanding:
After installing the sirius package, all data processing can be run from the command line using the command sirius or by invoking the package using python -m sirius. There are a number of customizable parameters in this script, which can be changed using flags when running the script from the command line:
| Argument | Type | Default | Description |
|---|---|---|---|
--dpi |
int | 150 |
Resolution of output plots |
--discrete-threshold |
int | 5 |
Number of responses below which numeric features are considered discrete |
--output-chart |
boolean | False |
Display images while running computation |
--charter |
choice | 'Plotly' |
The plotting library to use. Options: 'Plotly' or 'Seaborn' |
--debug |
boolean | False |
Print updates to the console while running |
--output-json |
boolean | False |
Output json and pngs to files |
--output-limit-n |
int | None |
Maximum number of data points to export into pairwise chart json files. By default, export all data points. |
--cache |
boolean | False |
Cache MI values to use later when generating visualizations |
--sample-n |
int | None |
Subsample the data. By default, work with all the data |
--input-file |
string | 'example_data/data.csv' |
Location of the input data csv |
--output-dir |
string | 'example_data/output' |
A directory in which to store the output json and png files |
For example, to process custom data using the tool, one might run from the command line:
sirius --debug --input-file=my_custom_data/data.csv --output-dir=my_custom_data/output --sample-n=1000 --cache > my_custom_data.log
which would run the data processing script with debugging enabled, specifying custom directories for data input and output, using a 1k-observation sample from the data frame, caching mutual information scores, and saving all logs to a log file.
The graph tool is a Django web server that runs locally. It reads data from one of two sources and renders a network graph in a browser window. The nodes in the graph represent features or variables. The edges connecting nodes represent the relationships between the features/variables. You can explore these relationships by clicking on edges. A graph detailing the statistical relationship between the nodes is displayed. For large graphs, the filter panel makes it easier to find the node you want.
Data can pulled from one of two locations. The default location is read from params.argv.json. These are default
parameters for the data processing tool. Specifically, the Graph tool looks in output directory defined by output_dir.
When output_dir is undefined, users are given the option to manually upload the output from the data processing steps.
| Data type | Node shape |
|---|---|
| Discrete | Square |
| Continuous | Circle |
From the root of the project folder run conda activate sirius_env.
From the root of the project folder run python manage.py runserver.
Then, navigate a browser window to http://127.0.0.1:8000
Click the upload data button. Select the output from the data processing** steps.
{
  "nodes": [
    {
      "name": "string_name_1",
      "type": "continuous OR discrete",
      "neighbors": ["string_name_1", "string_name_2", "string_name_3"]
    }
  ],
  "links": [
    {
      "source": "string_name_of_source_node",
      "target": "string_name_of_target_node",
      "weight": 0.8986,
      "viztype": "CC or DC or DD"
    }
  ]
}
See the 'example_data' folder for more detail.
If you would like to contribute to the development, WELCOME!
Please make sure you have npm installed.
Then npm install to install all required js libraries for development.
We use TypeScript in this project. Please execute ./node_modules/.bin/webpack to compile typescript into JavaScript.
Thorough documentation is required in development.
Please submit bugs and issues with the Github issue tracker.