A network is the collection of nodes that are connected by links. A node can represent a person, a family, a nation, a computer, a species, etc. Links defines a relationship between nodes such as friendship, kinship, a highway, who-is-eating-whom, etc. In the Netlogo model we will have turtles defined as the nodes. The links are defined by a special category link next to patch and turtle.
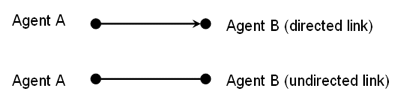
Links can be directed. A link that represents that agent A is the parent of agent B is a directed link (Figure 1). But a link that represents a friendship between agents A and B can be an undirected link. That is, if both agents see each other as friends.
*
Figure 1: Directed and undirected links between agents A and B.*
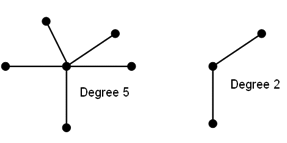
Each agent can have a number of links. The number of links an agent has is called the degree. If an agent has five undirected connections, then we would say that the degree of the agent is five (Figure 2). In some networks the degree is the same for each agent, while in others the degree is different for each agent. The distribution of degrees in a population of agents is an important characteristic of a network.
*
Figure 2. Central node has degree 5 (left) and 2 (right).*
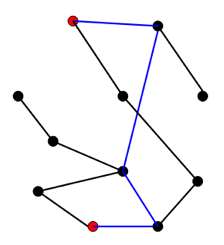
Another characteristic of networks is defined by the paths between nodes. In the figure below you see a path between the two red nodes. There are various paths possible. There are even different shortest paths of four links between the red nodes. We can calculate the average shortest path between each two nodes of a network. This leads to the average shortest path length of a network. Network structure affects the length of the shortest path and therefore it becomes an important indicator to compare networks. The shorter the average path length, the faster we will expect information will diffuse within a network.
*
Figure 3. Shortest path – 4 links – between two red nodes.*
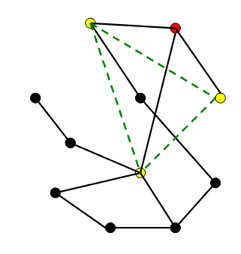
Finally we look at clustering coefficient of a network. This coefficient indicates how frequently links of a node are linked with each other. In social networks we can think of friends of person A also being friends of each other. A higher amount of friends of friends leads to more clustering. In the figure below you see that the red node has three (yellow) friends, but none of these friends are connected. Thus the clustering coefficient of the red node is zero. To calculate the clustering coefficient for a network, we take the average of the clustering coefficients for all nodes of a network.
*
Figure 4. Dotted green lines are missing connections between 3 yellow friends of red node.*
A network is visualized as a graph. Often these graphs have no spatial representation. It has when it represents highways or other physical networks. Otherwise, these graphs are just a graphical representation of the relationships. We will now discuss a number of different types of networks and see how they differ in the network metrics degree, path length and clustering.